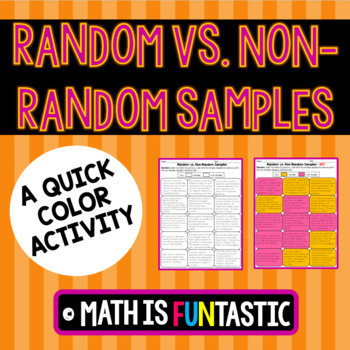
Random vs. Non-Random Samples Quick Color
Math is FUNtastic
937 Followers
Grade Levels
6th - 9th
Subjects
Resource Type
Standards
CCSS7.SP.A.1
CCSS7.SP.A.2
Formats Included
- PDF
Pages
1 student worksheet plus answer key
Math is FUNtastic
937 Followers
Also included in
- This math bundle contains 14 of my quick color products all related to 7th grade math standards. Quick colors are a fun, engaging student product where students are able to color their answers! Save 25% when you purchase this bundle. Included in the purchase are:Ratios and Proportional RelationshPrice $15.75Original Price $21.00Save $5.25
Description
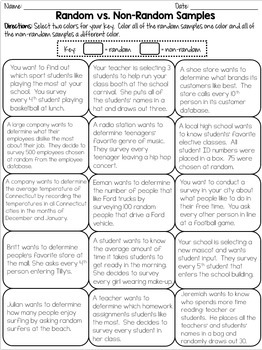
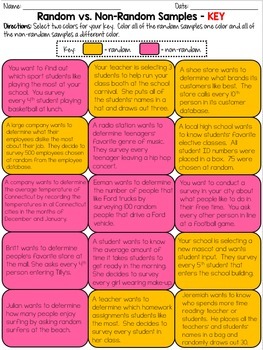
This ready to use product is a quick, fun way to have your students practice the differentiating between random and non-random samples. Students will be 15 problems and will need to classify each one as random or non-random. Instead of writing their answers, students will color them! You can either choose the colors for them to make it unified across the classroom or let them choose their own. This makes a great visual for your visual learners. This is an extremely easy assignment to grade! It is perfect for guided practice, homework, or re-teaching.
***SAVE MONEY AND PURCHASE MY 7TH GRADE QUICK COLOR BUNDLE!!***
You receive 14 fabulous quick colors at a 25% discount. This product is included. Click below.
7th Grade Math Quick Color Bundle
You might also be interested in:
• 7th Grade Math Bell Ringers, Warm-Ups, Exit Tickets
• Compound Probability Bundle
• Constant of Proportionality - Odd Man Out
• Cross Sections of 3D Figures Quick Color
• Expressions & Equations Error Analysis
• Independent and Dependent Variables Mazes
• Operations with Rational Numbers - Road Trip Application
• Parallel, Perpendicular, or Neither Sort
• Probability Project - Design Your Own Amusement Park
• Proportional vs. Non-Proportional Relationships Mazes
• Proportional Relationships Tournament Challenge
• Real-Life Area of Composite Figures
• Real-Life Surface Area & Volume
Be the first to know about the newest products and promotions. Follow Math is FUNtastic by clicking the green star above!
©️Math is FUNtastic 2018
This purchase is for one teacher only. Additional licenses are available at a discounted price.
Total Pages
1 student worksheet plus answer key
Answer Key
Included
Teaching Duration
30 minutes
Report this resource to TPT
Reported resources will be reviewed by our team. Report this resource to let us know if this resource violates TPT’s content guidelines.
Standards
to see state-specific standards (only available in the US).
CCSS7.SP.A.1
Understand that statistics can be used to gain information about a population by examining a sample of the population; generalizations about a population from a sample are valid only if the sample is representative of that population. Understand that random sampling tends to produce representative samples and support valid inferences.
CCSS7.SP.A.2
Use data from a random sample to draw inferences about a population with an unknown characteristic of interest. Generate multiple samples (or simulated samples) of the same size to gauge the variation in estimates or predictions. For example, estimate the mean word length in a book by randomly sampling words from the book; predict the winner of a school election based on randomly sampled survey data. Gauge how far off the estimate or prediction might be.


