Proportional Graphs TEACHER RESOURCES | IMAGES | MATH CLIPART
What educators are saying
Description
This resource includes 15 ready-to-use PROPORTIONAL GRAPH pictures (png format).
Insert these graphs into your own:
- Printable Worksheets
- Tests/Quizzes
- Lesson Slides/Presentations
- Exit Tickets/Lesson Quizzes
- Online Learning Management Systems (Canvas Quizzes, Google Forms. etc.)
**********************************************************************************************************
3 Levels of Difficulty (5 of each):
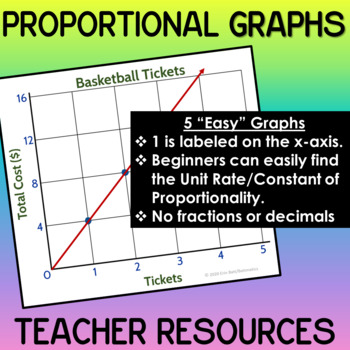
- EASY: No fractions or decimals. 1 is labeled on the x-axis making it easy for beginning students to find the Unit Rate/Constant of Proportionality.
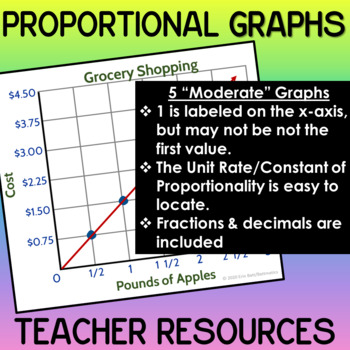
- MODERATE: Fractions and decimals (money) are included on each axis. 1 still appears on the x-axis, but it may not be the first value shown.
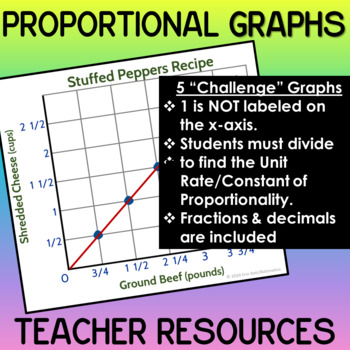
- CHALLENGE: More challenging combinations of numbers (fractions & decimals). 1 is NOT labeled on the x-axis. Students must divide to find the Unit Rate/Constant of Proportionality.
***********************************************************************************************************
Being a teacher is stressful enough…let this ready-to-go resource take one thing off your “to do” list!
TERMS OF USE (Proportional Graphs Pictures)
- PERSONAL USE LICENSE: This purchase includes a license for personal use by a single teacher or team of teachers in their classrooms. You may insert these graphs into lessons, daily assignments, exit tickets, quizzes, tests…both printable and digital as long as you follow the guidelines below.
- NOT FOR COMMERCIAL USE: No part of this product may be included in a resource intended to be sold. This includes (but is not limited to) printable, digital, and video resources in addition to online/for-profit teaching & tutoring businesses.
- IMAGE SHARING RESTRICTIONS: This product may be shared with colleagues in your grade level, school, and/or district, however it may not be shared with other individuals outside your district. I understand that many departments use Common Assessments or assign the same daily practice work, therefore I want this to be a “go-to’ resource for your team. However, please respect my work by keeping it within your immediate circle of coworkers.
- DIGITAL RESTRICTIONS: These graphs may be used in digital resources – but only if they are uploaded to password-protected classroom websites. The graphs may NOT be uploaded in any form to publicly accessible websites, social media, for-profit educational platforms, or educator lesson-sharing apps on any Learning Management System (may NOT be uploaded in any form to canvas commons or other similar spaces).
PROPORTIONAL REASONING DIGITAL RESOURCES FROM BATTMATICS:
- PROPORTIONAL RELATIONSHIPS DIGITAL MAZE
- PROPORTIONAL RELATIONSHIPS: TABLES & EQUATIONS
- PROPORTIONAL RELATIONSHIPS IN GRAPHS
OTHER DIGITAL ACTIVITIES YOU MIGHT ALSO LIKE:
- INTEGER OPERATIONS HIDDEN MESSAGES
- 2-STEP EQUATIONS WITH INTEGERS PARTNER PIXEL
- ADDING INTEGERS MYSTERY MANDALA 1A
- ADDING INTEGERS MYSTERY MANDALA 1B
- ADDING INTEGERS MYSTERY MANDALA 1C
- ADDING INTEGERS PIXEL ART BUNDLE
- MULTI-STEP EQUATIONS WITH FRACTIONS PARTNER PIXEL
- DISTRIBUTIVE PROPERTY EQUATIONS PARTNER PIXEL
- ESTIMATING SQUARE ROOTS #1 HIDDEN MESSAGES (NO NEGATIVES)
- ESTIMATING SQUARE ROOTS #2 HIDDEN MESSAGES (ALL NEGATIVES)
- SLOPE-INTERCEPT FORM PIXEL ART (WRITING EQUATIONS FROM GRAPHS)
WANT MORE?
Please visit my store or follow me to see more resources like this. You can also send me a message if you want a similar product to cover different standards. I am a new seller and just getting started but have the time to create that you might not have! I know this is a stressful year for many teachers, so please let me know if I can help you in any way.
CLICK HERE to follow me
CLICK HERE to visit my store


