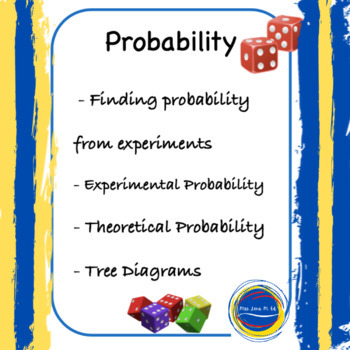
Probability Unit Middle School Math B.E.S.T. Standards
Mrs Lena
583 Followers
Grade Levels
7th - 8th, Homeschool
Subjects
Resource Type
Standards
CCSS7.SP.C.5
CCSS7.SP.C.7
CCSS7.SP.C.8
CCSS7.SP.C.8a
CCSS7.SP.C.8b
Formats Included
- PDF
- Easel Activity
Pages
10 pages
Mrs Lena
583 Followers
Easel Activity Included
This resource includes a ready-to-use interactive activity students can complete on any device. Easel by TPT is free to use! Learn more.
Description
Probability Unit Middle School Math Lesson on experimental and theoretical probability, tree diagrams, step by step explanations. This unit is aligned with 7th Grade Florida MA.7.DP.2.2 and MA.7.DP.2.3 B.E.S.T. Standards.
This pack covers:
- Finding probability from experiments
- Experimental probability
- Theoretical probability
- Tree diagrams
- Step by step explanations
- Answer key
This resource is great for:
- Math Centers
- Independent work
- Distance learning, eLearning
- At home learning, homework
- Assessment
- Initial instruction, review and re-teaching
Similar Resource(s):
- Percent Unit - Middle School Math
- Adding and Subtracting Fractions with Unlike Denominators | Nearpod Lesson
- Integers Grade 7 Addition & Subtraction
- Equations and Expressions - Independent Work Pack - Distance Learning
***********************************************************************************************************
• Be sure to FOLLOW MY STORE for NEW PRODUCTS AND SALES >> click here
• Don't forget to leave feedback . You will receive TPT credits to be used towards future purchases!
Have Fun Teaching Math!
Mrs. Lena, M.Ed.
Total Pages
10 pages
Answer Key
Included
Teaching Duration
N/A
Last updated May 3rd, 2020
Report this resource to TPT
Reported resources will be reviewed by our team. Report this resource to let us know if this resource violates TPT’s content guidelines.
Standards
to see state-specific standards (only available in the US).
CCSS7.SP.C.5
Understand that the probability of a chance event is a number between 0 and 1 that expresses the likelihood of the event occurring. Larger numbers indicate greater likelihood. A probability near 0 indicates an unlikely event, a probability around 1/2 indicates an event that is neither unlikely nor likely, and a probability near 1 indicates a likely event.
CCSS7.SP.C.7
Develop a probability model and use it to find probabilities of events. Compare probabilities from a model to observed frequencies; if the agreement is not good, explain possible sources of the discrepancy.
CCSS7.SP.C.8
Find probabilities of compound events using organized lists, tables, tree diagrams, and simulation.
CCSS7.SP.C.8a
Understand that, just as with simple events, the probability of a compound event is the fraction of outcomes in the sample space for which the compound event occurs.
CCSS7.SP.C.8b
Represent sample spaces for compound events using methods such as organized lists, tables and tree diagrams. For an event described in everyday language (e.g., “rolling double sixes”), identify the outcomes in the sample space which compose the event.


