Predator Prey Relationships Reading and Graphing Activity - Community Ecology
- Zip
- Google Apps™

What educators are saying
Also included in
- This NO PREP, PRINTABLE, EDITABLE, AND DIGITAL Biology Curriculum contains everything you need for an entire year of Biology! For less than $3 a day, you can save your time, energy, and sanity. Each of the 20 Complete Units includes a teaching PowerPoint presentation, notes, labs, homework assignmenPrice $525.00Original Price $988.18Save $463.18
- This printable, editable, and digital bundle of resources on Community Ecology covers community interactions, such as competition, symbiosis, predator-prey relationships, ecological disturbances and succession. Please complete list of topics below. This bundle includes everything you need to teach aPrice $29.50Original Price $38.49Save $8.99
- All of my ecology and environmental science resources (6 ecology unit bundles) are included in this one Super-Mega-Bundle! This mega-bundle includes all of the PowerPoints, notes, labs, task cards, homework assignments, review games, quizzes, activities, and unit tests that you need to teach a compPrice $178.00Original Price $252.64Save $74.64
Description
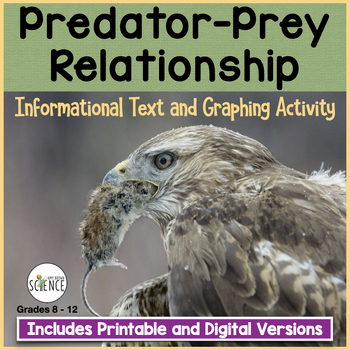
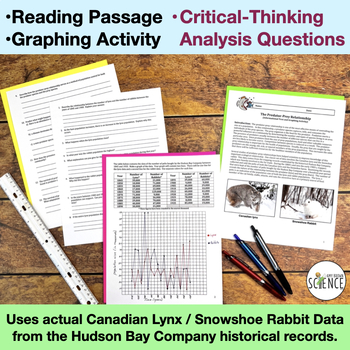
Students will dive into a reading activity on predator prey relationships, followed by a graphing activity that uses historical data from the Hudson Bay Company on lynx and rabbit populations over a 90 year period. Perfect for population ecology or community ecology units, this activity reinforces graphing skills and uses analysis questions to get students using their critical thinking skills.
Students will gain practice analyzing data and using graphs to make predictions.
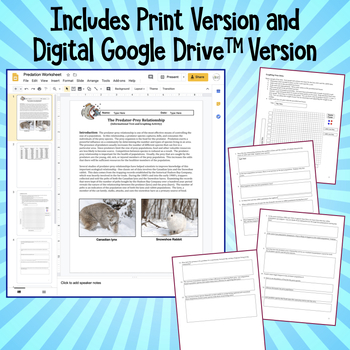
Choose to use the traditional printable version, or the paperless, digital Google Apps version. This resource is perfect for traditional classroom settings, distance learning, or for students in 1:1 classrooms.
What is included in this resource?
- Editable and Printable 4-page student handout
- Paperless Digital Version (not editable) for use in Google Drive, Google Classroom, and /or Microsoft OneDrive
- Teacher Guide and Answer Key
- Google Apps Teacher Guide
The study of the predator - prey relationship is fundamental to a unit on community ecology. This informational text, critical reading and graphing exercise will:
- Reinforce graphing skills.
- Develop problem solving and critical thinking skills.
- Enhance your instruction during your unit on community ecology.
- Provide a high quality classwork or homework assignment.
This assignment is suitable for life science and biology students in grades 8 - 12. I use this activity when teaching my unit on Community Ecology PowerPoint.
Students will begin the exercise by reading about the nature of the predator and prey relationship. The relationship is defined and the powerful influence that this relationship exerts on a community is explored.
Students are given data from the classic predator/prey study that involves the Canadian lynx and the Snowshoe rabbit. This data comes from the trapping records established by the historical Hudson Bay Company. Students will graph the data and answer 13 thought-provoking questions.
Related products include:
Lichens: Informational Text, Critical Reading and Lab Activity
FREE! Backyard Ecology: An Ecological Assessment of Your Back Yard
Graphing and Data Analysis Activity on the Symbiotic Relationships of Mycorrhizae
Community Ecology Quiz / Review Worksheet
Community Ecology REVIEW Powerpoint of 50 Questions/Answers
Community Ecology Homework and Study Guide
Introduction to Ecology PowerPoint with Notes for Teacher and Student
Population Ecology PowerPoint with Notes for Teacher and Student
Ecology Chat 2: Population Ecology
Community Ecology Powerpoint and Notes
Food Chains and Food Webs Activity
Ecosystems and the Biosphere Part 2: Biomes of the World PowerPoint and Notes
Humans Impact on the Environment PowerPoint and Notes
FREE Set of Six Ecology Crossword Puzzles
For updates about sales and new products, please follow my store:

