Pigs will be Pigs: An Interactive 5E Thematic Unit on Pigs, Money, and Graphing
the STEM Professor
178 Followers
Resource Type
Standards
CCSS2.MD.B.5
CCSS2.MD.C.8
CCSS2.MD.D.10
CCSS3.MD.B.3
CCSS5.NBT.A.3
Formats Included
- PDF
Pages
15 pages
the STEM Professor
178 Followers
Description
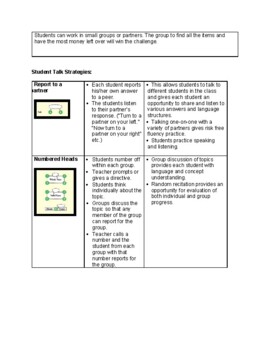
This 15 page lesson is fun of interactive, fun learning that connects math through literature. Pigs will be Pigs by Amy Axelrod is the focus of this awesome math lesson that teaches students about adding money, graphing, and reading a menu. Kids love it and have so much fun engaging in the activities. This lesson is great for English language learners, as it incorporates Student-Talk Strategies to engage students in student discourse relating to math content.
Total Pages
15 pages
Answer Key
N/A
Teaching Duration
N/A
Report this resource to TPT
Reported resources will be reviewed by our team. Report this resource to let us know if this resource violates TPT’s content guidelines.
Standards
to see state-specific standards (only available in the US).
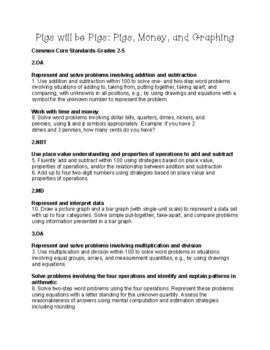
CCSS2.MD.B.5
Use addition and subtraction within 100 to solve word problems involving lengths that are given in the same units, e.g., by using drawings (such as drawings of rulers) and equations with a symbol for the unknown number to represent the problem.
CCSS2.MD.C.8
Solve word problems involving dollar bills, quarters, dimes, nickels, and pennies, using $ and ¢ symbols appropriately. Example: If you have 2 dimes and 3 pennies, how many cents do you have?
CCSS2.MD.D.10
Draw a picture graph and a bar graph (with single-unit scale) to represent a data set with up to four categories. Solve simple put-together, take-apart, and compare problems using information presented in a bar graph.
CCSS3.MD.B.3
Draw a scaled picture graph and a scaled bar graph to represent a data set with several categories. Solve one- and two-step “how many more” and “how many less” problems using information presented in scaled bar graphs. For example, draw a bar graph in which each square in the bar graph might represent 5 pets.
CCSS5.NBT.A.3
Read, write, and compare decimals to thousandths.


