Pie Charts - Pie Graphs - Interpreting Pie Charts - Calculating Percentages
The Autry Experiment
121 Followers
Description
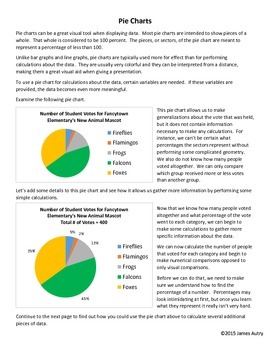
This is an activity designed to teach your students about pie charts and how to use data to calculate percentages.
This activity includes:
1. one page of informational text that details the function of a pie chart
2. one page that instructs your students on how to calculate percentages from known totals
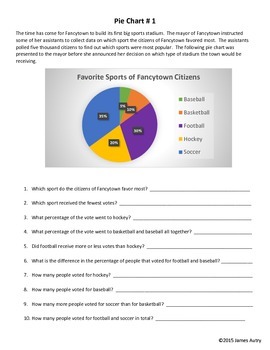
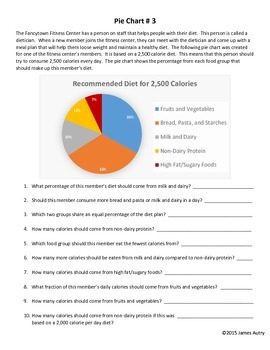
3. three pages designed to give your students some practice with pie charts and performing percentage calculations
4. a student activity page which will allow them to create a pie chart on a topic of their choosing
An answer key is provided and all graphs are re-created with patterned sectors to aid in printing if color is not an option.
A more comprehensive packet on representing data wich includes informational text and student activity sheets on tables, bar graphs, line graphs, and everything included in this product can be found here for only $6.00:
Representing Data: Tables, Bar Graphs, Line Graphs, and Pie Charts
Please follow my store if you like what you see and know that all feedback is greatly appreciated.
Total Pages
6 pages
Answer Key
Included
Teaching Duration
1 Week
Report this resource to TPT
Reported resources will be reviewed by our team. Report this resource to let us know if this resource violates TPT’s content guidelines.


