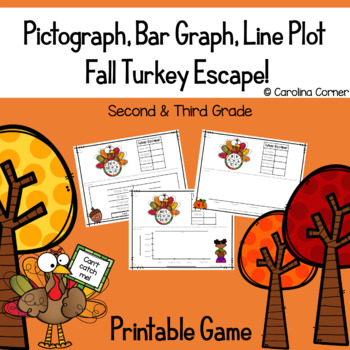
Pictograph, Bar Graph, Line Plot Thanksgiving Math Second and Third Grade
- PDF
Also included in
- These pictograph, bar graph, and line plot activities are bundled perfectly for every season in your second or third grade classroom! It includes six resources to engage your learners!Pictograph, Bar Graph, Line Plot Activities for use with Google ClassroomYour second and third grade students will lPrice $15.05Original Price $21.30Save $6.25
Description
In this Pictograph, Bar Graph, and Line Plot Activity, your second and third graders will love helping the turkeys escape from Thanksgiving dinner in all kinds of fun ways! Simply use a paperclip and pencil to spin the spinner on each gameboard, fill out the table, and use the data to create a pictograph, bar graph, or line plot!
This product includes:
-9 Pictograph Game Boards, with multiples of 2-10
-9 Bar Graph Game Boards, with multiples of 2-10
-9 Line Plot Game Boards, with multiples of 2-10
-Available in both Color and Black and White
*************************************************************************************************************
Check out some more fall resources!
Customer Tips:
How to get TPT credit to use on future purchases:
• Please go to your My Purchases page (you may need to login). Beside each purchase you'll see a Provide Feedback button. Simply click it and you will be taken to a page where you can give a quick rating and leave a short comment for the product. Each time you give feedback, TPT gives you feedback credits that you use to lower the cost of your future purchases. I value your feedback greatly as it helps me determine which products are most valuable for your classroom so I can create more for you. ☺
Be the first to know about my new discounts, freebies and product launches:
• Look for the green star next to my store logo and click it to become a follower. Voila! You will now receive email updates about this store. ☺
***************************************************************************


