Percent Activity (M & M Graphing)
Curt's Journey
252 Followers
Grade Levels
7th - 10th
Subjects
Resource Type
Standards
CCSS7.SP.A.1
Formats Included
- PDF
Pages
1 page
Curt's Journey
252 Followers
Also included in
- I used to teach pre-algebra, and these resources came in very handy.Check them out! You can look at the links for previews and clear descriptions.Price $5.99Original Price $8.29Save $2.30
Description
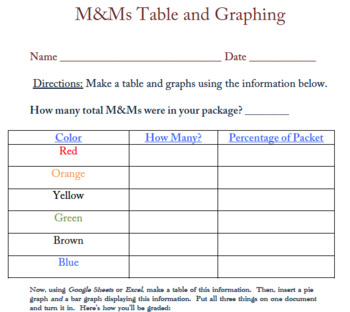
Each student must have a pack of M&Ms.
- They count how many of each color.
- Find out what percentage of the package is blue, yellow, etc.
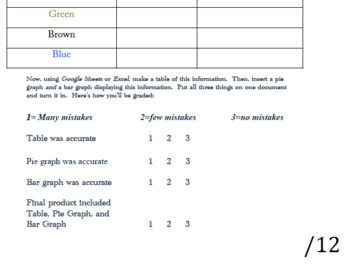
- Then, using a spreadsheet, students make a bar and pie graph.
- Rubric at the end.
VISIT MY STORE…
THIS RESPONSE JOURNAL MIGHT BE HELPFUL, TOO!
Total Pages
1 page
Answer Key
Rubric only
Teaching Duration
N/A
Report this resource to TPT
Reported resources will be reviewed by our team. Report this resource to let us know if this resource violates TPT’s content guidelines.
Standards
to see state-specific standards (only available in the US).
CCSS7.SP.A.1
Understand that statistics can be used to gain information about a population by examining a sample of the population; generalizations about a population from a sample are valid only if the sample is representative of that population. Understand that random sampling tends to produce representative samples and support valid inferences.

