TPT
Total:
$0.00

Ozone Depletion Data Analysis 5E Lab-- Computer Lab

Rated 4.38 out of 5, based on 8 reviews
4.4 (8 ratings)
;
Strategic Science
1.5k Followers
Grade Levels
9th - 12th, Higher Education
Resource Type
Standards
Formats Included
  • Word Document File
  • Webquests
Pages
16 pages
$5.00
$5.00
Share this resource
Report this resource to TPT
Strategic Science
1.5k Followers
Compatible with Digital Devices
The Teacher-Author has indicated that this resource can be used for device-based learning.

What educators are saying

I used this with my AP Environmental students. This was a fantastic resource to help them analyze changes in the ozone layer.
Also included in
  1. Use these products to help your students learn important topics and skills.
    Price $10.00Original Price $11.25Save $1.25
  2. This bundle includes these resources for AP Environmental Science including:Study guides with EXACTLY what students need to know for each unit (more detail than the CED). Full practice exam.Lots of labs and activitiesGraphic organizersMath practiceDiagram and chart notes for specific, difficult top
    Price $200.00Original Price $227.25Save $27.25

Description

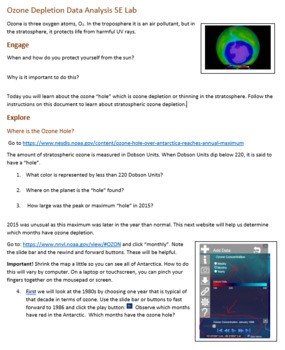
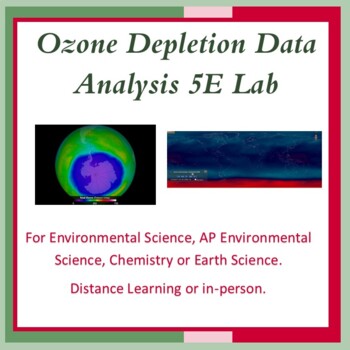
Use this inquiry lab with in-person or distance learning students. 7 pages for students with key included. This lab is not a simulation, but rather looking at data from various sources.

Time: 2-4 days (90 minutes to 3 hours depending on level of students and whether you choose to assign the elaborate and evaluate)

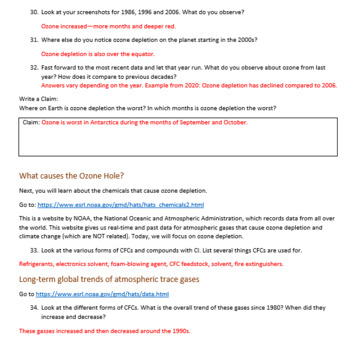
Students use real online data to determine trends in ozone depletion around the globe and trends in ozone-depleting chemicals along with the science and current trends.

Use with Environmental Science, AP Environmental Science, Chemistry or Earth Science classes.

Students need access to a computer—working in pairs suffices.

5E

Engage: Quick, simple questions about sun protection for students to use previous knowledge about the sun and UV rays.

Explore: Students use several NOAA websites to determine where ozone depletion is the worst, the months ozone depletion is the worst, and the trends over the decades and make a claim.

Next, students review information about CFCs and HFCs, analyze graphs about their usage, the Montreal Protocol and make a claim.

Explain: Non-fiction text to explain how stratospheric ozone is formed and destroyed, why Antarctica and which months.

Elaborate: (optional): A short activity with articles about ozone depletion in 2019 and 2020 and the need for long-term data in science.

Evaluate: Finding Solutions (optional): Students practice with making claims and evidence as they read a position paper about strengthening the Montreal Protocol.

Total Pages
16 pages
Answer Key
Included
Teaching Duration
3 hours
Report this resource to TPT
Reported resources will be reviewed by our team. Report this resource to let us know if this resource violates TPT’s content guidelines.

Standards

to see state-specific standards (only available in the US).
NGSSHS-ESS3-6
Use a computational representation to illustrate the relationships among Earth systems and how those relationships are being modified due to human activity. Examples of Earth systems to be considered are the hydrosphere, atmosphere, cryosphere, geosphere, and/or biosphere. An example of the far-reaching impacts from a human activity is how an increase in atmospheric carbon dioxide results in an increase in photosynthetic biomass on land and an increase in ocean acidification, with resulting impacts on sea organism health and marine populations. Assessment does not include running computational representations but is limited to using the published results of scientific computational models.
NGSSHS-ESS3-4
Evaluate or refine a technological solution that reduces impacts of human activities on natural systems. Examples of data on the impacts of human activities could include the quantities and types of pollutants released, changes to biomass and species diversity, or areal changes in land surface use (such as for urban development, agriculture and livestock, or surface mining). Examples for limiting future impacts could range from local efforts (such as reducing, reusing, and recycling resources) to large-scale geoengineering design solutions (such as altering global temperatures by making large changes to the atmosphere or ocean).

Reviews

Questions & Answers

1.5k Followers