TPT
Total:
$0.00

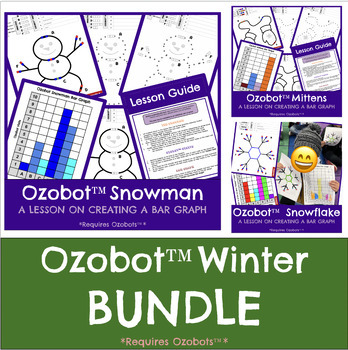
Ozobot™️ Coding - WINTER BUNDLE of 3 Bar Graph Lessons

;
Jillian Poe
23 Followers
Grade Levels
PreK - 6th, Homeschool
Standards
Formats Included
  • Zip
Pages
30 pages
$4.50
List Price:
$6.00
You Save:
$1.50
Bundle
$4.50
List Price:
$6.00
You Save:
$1.50
Bundle
Share this resource
Report this resource to TPT
Jillian Poe
23 Followers

Products in this Bundle (3)

    Also included in
    1. These are engaging STEM/STEAM activities!In these 21 beginner Ozobot™️ Lessons students will learn to create programs (color codes and thick lines) and a bar graph based on their robot's path. These lessons are intended for TK-3, however, they are great beginner, intermediate, or advanced lessons for
      Price $30.00Original Price $42.00Save $12.00

    Description

    These are engaging STEM/STEAM activities!


    In these beginner Ozobot™️ Lessons students will learn to create programs (color codes and thick lines) and a bar graph based on their robot's path. These lessons are intended for TK-3, however, they are great beginner, intermediate, or advanced lessons for any age (or even perfect lessons for CHRISTMAS, JANUARY, WINTER or HOLIDAY activities!!).


    For these lessons you will need an Ozobot™️, red, blue, green, and black markers, and crayons, colored pencils, or markers. You may do these lessons with an individual, partners, or even groups. Each lesson will take approximately 100 minutes to complete, depending on the grade level and worksheet level you choose to give them.


    You might also be interested in:

    Ozobot Bar Graph BUNDLES & what they include:

    ULTIMATE OZOBOT BUNDLE! Includes ALL 21 Ozobot bar graph lessons!


    If you are not following, please join me!  :)  More products to come!  I also welcome and appreciate your feedback, so please take a moment to rate my product. Enjoy

    Total Pages
    30 pages
    Answer Key
    Included
    Teaching Duration
    N/A
    Report this resource to TPT
    Reported resources will be reviewed by our team. Report this resource to let us know if this resource violates TPT’s content guidelines.

    Standards

    to see state-specific standards (only available in the US).
    Identify whether the number of objects in one group is greater than, less than, or equal to the number of objects in another group, e.g., by using matching and counting strategies.
    Organize, represent, and interpret data with up to three categories; ask and answer questions about the total number of data points, how many in each category, and how many more or less are in one category than in another.
    Draw a picture graph and a bar graph (with single-unit scale) to represent a data set with up to four categories. Solve simple put-together, take-apart, and compare problems using information presented in a bar graph.
    Draw a scaled picture graph and a scaled bar graph to represent a data set with several categories. Solve one- and two-step “how many more” and “how many less” problems using information presented in scaled bar graphs. For example, draw a bar graph in which each square in the bar graph might represent 5 pets.

    Reviews

    Questions & Answers

    23 Followers