Ontario Grade 8 Full Year Bundle - Math - GOOGLE AND PDF
- Zip
- Google Apps™

What educators are saying
Products in this Bundle (5)
Also included in
- Split grade teaching made easy! GOOGLE CLASSROOM VERSION - PDF INCLUDED! This gives you the ability to print worksheets as well as distribute a digital copy of the resource to your students on Google Classroom.Grade 7 - New Ontario Math Curriculum 2020 – This bundle covers all expectations in the GrPrice $85.00Original Price $123.40Save $38.40
- FULL YEAR BUNDLE - Teaching made easy! This DIGITAL AND PDF bundle includes everything you need to teach Math, Science and Social Studies. It covers all the expectations in the Ontario curriculums. It gives you the ability to print worksheets as well as distribute a digital copy of the resource to yPrice $85.00Original Price $127.95Save $42.95
- FULL YEAR BUNDLE - Teaching made easy! This DIGITAL AND PDF bundle includes everything you need to teach Math, Science and Social Studies. It covers all the expectations in the Ontario Grade 7 & 8 curriculums. Grade 7 - New Ontario Math Curriculum 2020 Strand B - Number (Number Sense and OperatiPrice $185.00Original Price $267.39Save $82.39
Description
Distance Learning made easy! GOOGLE CLASSROOM VERSION - PDF INCLUDED! This gives you the ability to print worksheets as well as distribute a digital copy of the resource to your students on Google Classroom.
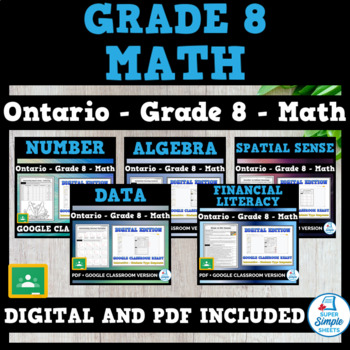
Grade 8 - New Ontario Math Curriculum 2020 – This bundle covers all expectations in the Grade 8 - New Ontario Math Curriculum. Included are 1266 activity sheets for your students to learn the overall and specific expectations outlined by the Ministry of Education.
Strand B - Number (Number Sense and Operations)
Concepts that are covered:
- Very large numbers (trillions) and small numbers using scientific notation
- Perfect squares and square roots
- Estimating square roots using a variety of strategies
- Irrational and rational numbers
- Comparing and ordering rational numbers – fractions, decimals, and integers
- Plotting fractions, integers, decimals, and percents on a number line
- Converting fractions, decimal numbers, and percents
- Understanding percents greater than 100
- BEDMAS using square roots, exponents, and positive/negative integers
- Order of operations written as fractions
- Evaluating exponents
- Multiplying and dividing by powers of 10
- Relationship between multiplying by 0.1 and dividing by 10
- Adding and subtracting integers using numerous strategies – zero pairs, models
- Multiplying and dividing integers using rules and models
- Adding, subtracting, multiplying and dividing fractions using models and rules
- Identifying proportional and non-proportional relationships in various situations.
- Determining the value of a missing value in a ratio
- Word problems for all basic concepts for students to apply their understanding
- 5 Unit Tests
Strand C - Algebra (Patterns, Equations, Coding)
- Translating growing and shrinking patterns using tables of values and graphs
- Determining pattern rules to extend patterns
- Representing patterns in table of values
- Constant rates and initial values
- Representing patterns using algebraic expressions to help solve for any term in a pattern
- Linear patterns – analyzing patterns in graphs
- Representing linear patterns using equations
- Creating and describing patterns using rational numbers
- Positive and negative integers in patterns
- Exponents in patterns – relationships among rational numbers
- Adding and subtracting monomials with a degree of 1
- Adding binomials with a degree of 1
- Evaluate algebraic expressions that involve rational numbers
- Solve equations that involve multiple terms, integers and decimal numbers
- Solve inequalities that involve integers and multiple terms
- Graph inequalities using a number line and a cartesian plane
- Intro to slope – determining the slope of a line to assist with students graphing 2-variable inequalities
- Defined counts and concurrent coding
- Conditional codes – if/then statements
- Use coding to create programs that display data purposefully
- Analyze data presented in programs and draw conclusions about the data
- 3 Unit Tests – 1 for each strand: Patterns, Equations, and Coding
Strand D - Data (Data Literacy and Probability)
- Identifying graphs and situations that involve one-variable and two-variable data
- Interpreting bar graphs, broken-line graphs, multiple-bar graphs, circles graphs and scatter plots
- Creating a variety of graphs, including circle graphs and scatter plots
- Determining the mean, median, and mode of data sets
- Determining the impact of adding or removing outliers from a data set on the mean, median, and mode
- Finding the missing value in a data set using the mean
- Determining outliers in a data set and how they affect scatter plots and other graphs
- Draw a line of best fit on a scatter plot to allow for predictions to be made about the data
- Describe the relationship between variables as being strong, weak, none, positive, or negative
- Creating and interpreting infographics
- Drawing conclusions about different sets of data
- Thinking critically about misleading graphs
- Using fractions, decimals, and percents to represent the probability of multiple events
- Understanding the difference between theoretical and experimental probability
- Understanding the difference between dependent and independent events
- Comparing theoretical and experimental probabilities of independent and dependent events
- Using tree diagrams to represent independent and dependent events
- Use Venn diagrams to represent probabilities and help solve probability problems
Strand E - Spatial Sense
- Tessellations – regular polygons that tessellate
- Naming tessellations – regular, semi-regular, irregular
- Creating tessellations using translations, reflections, and rotations
- Drawing top, front, and side views of objects
- Isometric drawings of 3D objects
- Cavalier and cabinet drawings
- Perspective drawings using one-point perspectives and multiple vanishing points
- Drawing and interpreting scaled drawings
- Calculating area and volume of shapes and objects using scaled dimensions
- Enlargements and reductions of figures
- Performing and describing dilations using scale factors on a cartesian plane
- Use of mapping rules to determine new coordinates after a transformation – translations, rotations, reflections, and dilations
- Translations, reflections, and rotations of up to 360 degrees on a cartesian plane
- Representing very large numbers (mega, giga, and tera) as well as very small units (micro, nano, and pico)
- Use angle properties (complimentary/supplementary angles, opposite angles) to determine missing angle measurements
- Use angle properties to determine interior angles in all polygons – formula (n-2) x 180
- Determine the perimeter, area, and volume of composite 2D shapes and 3D objects
- Use the Pythagorean theorem to determine if a triangle is a right triangle
- Use the Pythagorean theorem to calculate the length of a side on a right triangle
Strand F - Financial Literacy
- Converting currencies to Canadian (CAD)
- Comparing the values or different currencies
- Answer word problems that involve currency exchanges
- Describing some advantages and disadvantages of various method of payments
- The pros and cons of using different methods of payment to convert currencies
- Assignment – Researching currencies – denominations, value, exchange rate to CAD
- Creating personal well-balanced budgets – income, earnings, expenses, and savings
- Analyzing pre-made budgets that are made for a scenario (e.g. saving for college)
- Creating a financial plan to reach long-term financial goals
- The difference between gross and net income
- Calculating income tax using tax brackets and using this information to calculate net income
- Typical wages and salaries in your community
- Simple interest versus compound interest
- Cost of borrowing over time
- Using compound interest calculators online to see the power of compound interest
- Earnings actualized by investing long-term (compound interest)
- Comparing credit card fees and offers (rewards)
- Customer loyalty programs – research assignment and other activities
- Evaluating incentive programs from different businesses
- Getting more value for your money – buying second hand safely
- Consumer contracts – cell phones, video and music streaming examples
- Unit Test
***Answer Pages for all worksheets are included
Follow Super Simple Sheets for more resources like this one!


