Brandy Neal
43 Followers
Description
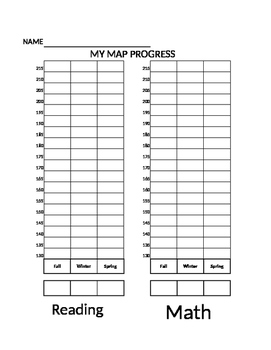
I made this chart to track how my students did on MAP from Fall to winter, then spring. I highlight where their goal is on the chart. Then after fall testing I will make a colored line how far they made it. I will let them color the bar graph in up to the line I colored. Higher grades may be able to mark the RIT score themselves but my firsties need a little help. They keep this is their data binders all year. Before the winter testing, we will pull these out and highlight another goal for winter. We celebrate every little point on MAP. This helps them see their progress!
Total Pages
Answer Key
N/A
Teaching Duration
N/A
Report this resource to TPT
Reported resources will be reviewed by our team. Report this resource to let us know if this resource violates TPT’s content guidelines.


