TPT
Total:
$0.00

Measures of Central Tendency Doodle Notes (Mean, Median, Mode, & Range)

Rated 4.83 out of 5, based on 1216 reviews
4.8 (1.2k ratings)
;
Math Giraffe
25k Followers
Grade Levels
6th - 8th
Subjects
Standards
Formats Included
  • PDF
Pages
1 plus answer key & info
$1.75
$1.75
Share this resource
Report this resource to TPT
Math Giraffe
25k Followers

What educators are saying

My school does a quick mean/median/mode review at the beginning of the school year. The kids enjoyed these doodle notes.
My students used this as a review of central tendency before we started our sample and population unit. They loved the look of it and really liked color coordinating that the doodles notes allow you to do.

Description

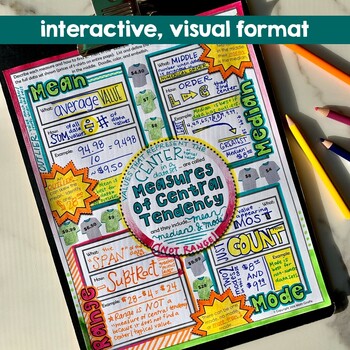
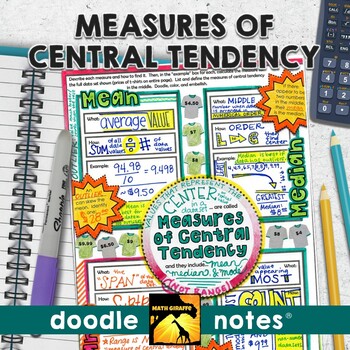
Mean, Median, Mode, and Range (Measures of Central Tendency): "doodle notes" - visual note taking pages with interactive tasks for building stronger retention of measures of center (mean, median, mode, and range) for your middle school statistics unit in Pre-Algebra

Boost your students' focus and memory! The blend of graphic and linguistic input in these guided visual notes helps students' brains to convert the information to long-term memory more easily.

When students color or doodle in math class, it activates both hemispheres of the brain at the same time. There are proven benefits of this cross-lateral brain activity:

- new learning

- relaxation (less math anxiety)

- visual connections

- better memory & retention of the content!

Students fill in the sheets, answer the questions, and color, doodle or embellish. Then, they can use it as a study guide later on.

Content includes:

- What are measures of central tendency?

- How to find mean, median, mode, and range

- Special cases - more than one mode, averaging two middle numbers to find a median, etc.

- When each measure is best (outliers, etc.)

- Example for each

Check out the preview for more detail about this item and the research behind it.

Visual note taking strategies like sketch notes or doodle notes are based on dual coding theory.  When we can blend the text input with graphic/visual input, the student brain processes the information differently and can more easily convert the new learning into long-term memory.

This strategy also integrates the left and right hemispheres of the brain to increase focus, learning, and retention!

If you’d like to get the benefits of the doodle note method for your students ALL throughout middle school, get the full set:

Middle School Pre-Algebra Doodle Notes (Discounted Bundle)

Total Pages
1 plus answer key & info
Answer Key
Included
Teaching Duration
30 minutes
Report this resource to TPT
Reported resources will be reviewed by our team. Report this resource to let us know if this resource violates TPT’s content guidelines.

Standards

to see state-specific standards (only available in the US).
Recognize that a measure of center for a numerical data set summarizes all of its values with a single number, while a measure of variation describes how its values vary with a single number.
Summarize numerical data sets in relation to their context, such as by:
Giving quantitative measures of center (median and/or mean) and variability (interquartile range and/or mean absolute deviation), as well as describing any overall pattern and any striking deviations from the overall pattern with reference to the context in which the data were gathered.
Use measures of center and measures of variability for numerical data from random samples to draw informal comparative inferences about two populations. For example, decide whether the words in a chapter of a seventh-grade science book are generally longer than the words in a chapter of a fourth-grade science book.

Reviews

Questions & Answers

25k Followers