Mean Median Mode and Range Exploration Lab & Graphing Activity
- PDF
Description
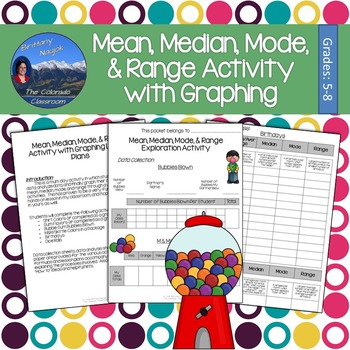
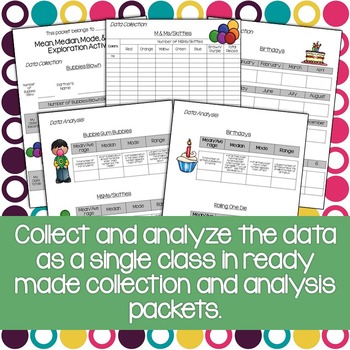
Mean, median, mode, and range are explored in this activity lesson pack complete with lesson plans, student packets, and graphing pages. You and your students will tackle these four important measures of central tendency through a fun lab activity involving bubble gum, M&Ms, birthdays, dice, and more. Students will collect data, analyze their data, and then graph their results all while learning about the mean, median, mode, and range of various scenarios.
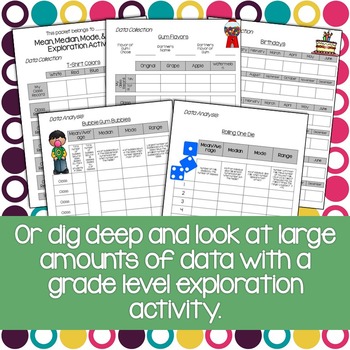
This activity is prepared and ready to be enjoyed as a single class with 4 lab activities, or as an entire grade level activity (please buy the appropriate number of licenses) with 6 lab activities. Lesson plans for either scenario and student worksheets for both options are included and are clearly marked.
You receive:
• 4 Cover pages that clearly mark the different sections
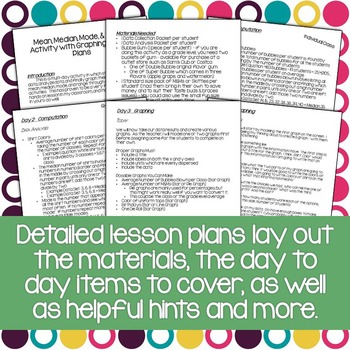
• 23 Lesson plan pages clearly guiding you through the lesson with examples, scripts, helpful hints, and more
• 5 Individual Classroom pages (3 Data Collection pages & 2 Data Analysis pages)
• 14 Group Classroom pages (8 Data Collection pages & 6 Data Analysis pages)
• 5 Graph Paper pages
You may also like:
Mean, Median, Mode, and Range Activity for Halloween
Whole Number Review Scavenger Hunt
Customer Tips:
How to get TpT credit to use on future purchases:
* Please go to your My Purchases page (you may need to login. Beside each purchase you'll see a Provide Feedback button. Simply click it and you will be taken to a page where you can give a quick rating and leave a short comment for the product. Each time you give feedback, TpT gives you feedback credits that you use to lower the cost of your future purchases. I value your feedback greatly as it helps me determine which products are most valuable to you and for your classroom, so I can create more of what you're looking for. :)
* Click on "Become a Follower" to join my store.
* Be the first to know about my new discounts, freebies, and product launches.
* Receive updates about this store.


