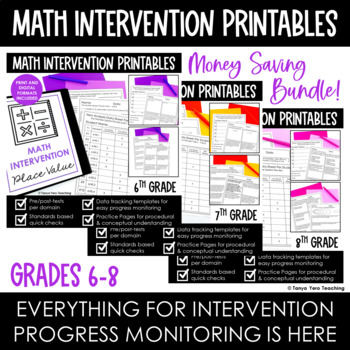
Math Intervention 6th Grade 7th Grade 8th Grade RTI Progress Monitoring Bundle
- Zip
- Google Apps™

What educators are saying
Products in this Bundle (18)
showing 1-5 of 18 products
Also included in
- A comprehensive, no prep, standards-based bundle of RTI math intervention resources for grades K-8. This research-based intervention bundle includes tools for building a systematic, data-driven intervention process.With pre/post-tests (for each domain) for executing screening, quick checks for progrPrice $299.00Original Price $395.00Save $96.00
Description
A comprehensive, no prep, standards-based bundle of RTI math intervention resources for grades 6-8. This research-based intervention bundle includes tools for building a systematic, data-driven intervention process.
With pre/post-tests (for each domain) for executing screening, quick checks for progress monitoring, practice pages for guided and independent practice and data tracking forms, this math intervention kit will organize and transform your intervention instruction.
Finding the time in your math block to provide RTI math intervention services to students is difficult. This intervention bundle saves you time by assembling all of the resources you need in one complete bundle for grades 6-8. No more searching for the right resources and patching them together.
This progress monitoring bundle contains 5 intervention sets for each domain for grades 6-8 math- all standards included!
If you purchase the bundles for each grade level individually the cost would be $110. Save $5 with this MEGA BUNDLE!
Here is what you get for each domain:
- Pre/Post Tests for each domain including item analysis for each assessment
- Quick checks for each standard
- Practice pages for each standard—segmented by procedural and conceptual understanding
- Procedural and conceptual questioning
- Progress monitoring graphing forms
- Excel RTI graphing pack
- Print (PDF) and digital versions (made within Google Slides)
---------------------------------------------------------------------------------------------------------
Each set contains the resources you need to precisely target student needs, close gaps, progress monitor and produce visual representations of intervention data as you deliver your instruction.
Use these materials to make data-driven decisions for intervention students and as preventative maintenance for your whole class.
Hyper-targeting is very important in providing intervention services and we include an item analysis with each pre-test and post-test so you can identify exactly which skills need extra support.
Procedural and conceptual questioning are included and identified so you can zero in on each students' strengths and weaknesses. Research-based principles are used in this resource and an explanation page is included if you need documentation of such for administration. Data tools for progress monitoring are included as well, including a digital Excel file for easy creation of professional looking graphs.
Take the guess work out of providing intervention and focus on what you do best…delivering quality instruction to your students!
Standards & Topics Covered for 6th grade:
Ratios and Proportional Relationships
- 6.RP.1 – Understanding ratios
- 6.RP.2 –Understanding unit rates associated with a ratio
- 6.RP.3 – Use ratio and rate reasoning to solve real world problems
The Number System
- 6.NS.1 - Interpreting and commuting quotients of fractions
- 6.NS.2 – Fluently divide multi-digits numbers
- 6.NS.3 – Fluently add, subtract, multiply, and divide
- 6.NS.4 – Finding the greatest common factor of two numbers
- 6.NS.5 – Understanding positive and negative numbers
- 6.NS.6 – Understanding a rational number as a point on a number line
- 6.NS.7 – Ordering absolute value of rational numbers
- 6.NS.8 – Solve real world problems by graphing points on a coordinate plane
Expressions and Equations
- 6.EE.1 – Write and evaluate numerical expressions involving exponents
- 6.EE.2 – Write, read, and evaluate expressions using variables
- 6.EE.3 - Apply the properties of operations to generate equivalent expressions.
- 6.EE.4 - Identify when two expressions are equivalent
- 6.EE.5 - Understand solving an equation or inequality as a process of answering a question
- 6.EE.6 - Use variables to represent numbers and write expressions when solving a real-world or mathematical problem
- 6.EE.7 - Solve real-world and mathematical problems by writing and solving equations
- 6.EE.8 – Writing inequalities
- 6.EE.9 – Using variables to represent two quantities in real world problems
Geometry
- 6.G.1 – Finding area of triangles
- 6.G.2 – Finding volume of prisms with fractional length amounts
- 6.G.3 – Drawing polygons on a coordinate plane
- 6.G.4 - Represent three-dimensional figures using nets made up of rectangles and triangles
Statistics and Probability
- 6.SP.1 – Recognize statistical questions
- 6.SP.2 - Understand that a set of data collected to answer a statistical question has a distribution
- 6.SP.3 – Measuring the center of data
- 6.SP.4 - Display numerical data in plots on a number line, including dot plots, histograms, and box plots
- 6.SP.5 – Summarize numerical data sets
7th grade:
Ratio and Proportions
- 7.RP.1 - Compute ratios
- 7.RP.2 - Recognize and represent proportional relationships between quantities
- 7.RP.3 - Use scale factors and unit rates in proportional relationships to solve ratio and percent problems
The Number System
- 7.NS.1 – Addition and subtraction of rational numbers
- 7.NS.2 - Apply and extend previous understandings of multiplication and division
- 7.NS.3 – Solve real world problems with rational numbers
Expressions and Equations
- 7.EE.1 – Generating equivalent expressions with rational coefficients
- 7.EE.2 - Understand that equivalent expressions can reveal real-world and mathematical relationships
- 7.EE.3 – Solve multi-step real-world and mathematical problems posed with rational numbers in algebraic expressions
- 7.EE.4 – Use variables to represent quantities to solve real-world or mathematical problems
Geometry
- 7.G.1 – Solve problems involving scale drawings of geometric figures
- 7.G.2 – Understanding and classifying triangles
- 7.G.3 – Describe the two-dimensional figures
- 7.G.4 – Understand area and circumference of a circle.
- 7.G.5 – Angles
- 7.G.6 – Area, perimeter, and volume of various shapes
Statistics and Probability
- 7.SP.1 – Understanding statistics
- 7.SP.2 – Generate multiple random samples
- 7.SP.3 – Recognize the role of variability when comparing two populations
- 7.SP.4 – Use measures of center and measures of variability for numerical data from random samples to draw comparative inferences about two populations
- 7.SP.5 – Understand that the probability of a chance event is a number between 0 and 1 that expresses the likelihood of the event occurring
- 7.SP.6 – Experimental probability
- 7.SP.7 – Develop a probability model and use it to find probabilities of simple events
- 7.SP.8 – Determine probabilities of compound events using organized lists, tables, tree diagrams, and simulation
8th Grade:
Functions
- 8.F.1 - Understand that a function is a rule that assigns to each input exactly one output
- 8.F.2 - Compare properties of two functions each represented in a different way
- 8.F.3 - Interpret the equation y = mx + b as defining a linear function, whose graph is a straight line
- 8.F.4 - Construct a function to model a linear relationship between two quantities
- 8.F.5 - Describe qualitatively the functional relationship between two quantities by analyzing a graph
The Number System
- 8.NS.1 – Understand that every number has a decimal expansion
- 8.NS.2 - Use rational approximations of irrational numbers
Expressions and Equations
- 8.EE.1 – Develop and apply the properties of integer exponents to generate equivalent numerical expressions
- 8.EE.2 – Square and cube roots
- 8.EE.3 – Use numbers expressed in scientific notation to estimate very large or very small quantities and to express how many times as much one is than the other
- 8.EE.4 – Perform multiplication and division with numbers expressed in scientific notation to solve real-world problems
- 8.EE.5 – Graph proportional relationships, interpreting the unit rate as the slope of the graph
- 8.EE.6 - Use similar triangles to explain why the slope m is the same between any two distinct points on a non-vertical line in the coordinate plane
- 8.EE.7 – Solve linear equations in one variable
- 8.EE.8 – Analyze and solve pairs of simultaneous linear equations
Geometry
- 8.G.1 – Verify experimentally the properties of rotations, reflections, and translations
- 8.G.2 – Using transformations to define congruency
- 8.G.3 – Describe the effect of dilations about the origin, translations, rotations about the origin in 90-degree increments, and reflections across the -axis and -axis on two-dimensional figures using coordinates
- 8.G.4 – Use transformations to define similarity
- 8.G.5 – Use informal arguments to analyze angle relationships
- 8.G.6 – Explain the Pythagorean Theorem and its converse
- 8.G.7 – Apply the Pythagorean Theorem and its converse to solve real-world and mathematical problems
- 8.G.8 – Apply the Pythagorean Theorem to find the distance between two points in a coordinate system
- 8.G.9 – Understand how the formulas for the volumes of cones, cylinders, and spheres are related and use the relationship to solve real-world and mathematical problems.
Statistics and Probability
- 8.SP.1 – Interpreting line plots
- 8.SP.2 – Understanding Bivariate quantitative data
- 8.SP.3 – Use the equation of a linear model to solve problems in the context of bivariate quantitative data, interpreting the slope and y-intercept
- 8.SP.4 – Understand that patterns of association can also be seen in bivariate categorical data by displaying frequencies and relative frequencies in a two-way table


