Math 1 Unit 2 Lessons 1-20 Equation, Function & Inequality Video & Wrksht Bundle
Products in this Bundle (22)
showing 1-5 of 22 products
Bonus
Description
This bundle consists of the following twenty (20) Math 1 - Unit 2 Equations, Functions and Inequalities Lesson Videos, Student Worksheets and Teacher Answer Keys:
- Lesson 1 - Solving 1-Step Equations and Word Problems
- Lesson 2 - Solving 2-Step Equations and Word Problems
- Lesson 3 - Solving Multi-Step Equations
- Lesson 4 - Solving Multi-Step Equation Word Problems
- Lesson 5 - Solving Literal Equations
- Lesson 6 - Graphing SIF Equations with X-Y Table
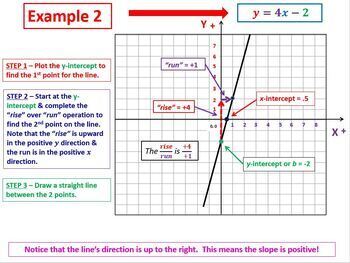
- Lesson 7 - Graphing SIF Equations with Slope & Y-Intercept
- Lesson 8 - Writing SIF Equations with Slope & Y-Intercept
- Lesson 9 - Writing SIF Equations with Slope & 1 Point on Line
- Lesson 10 - Writing SIF Equations with 2 Points on Line
- Lesson 11 - Graphing Standard Form Equations with X-Y Table
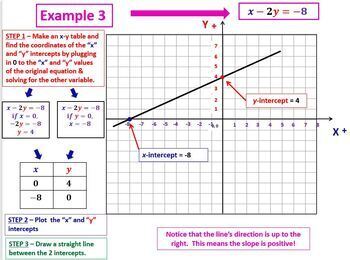
- Lesson 12 - Graphing Standard Form Equations with X & Y Intercepts
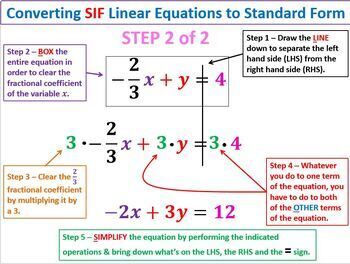
- Lesson 13 - Converting from SIF to Standard Form of Equations
- Lesson 14 - Converting from Standard Form to SIF of Equations
- Lesson 15 - Solving 1-Step Inequalities
- Lesson 16 - Solving 2-Step Inequalities
- Lesson 17 - Graphing Inequalities in One Variable
- Lesson 18 - Graphing Inequalities in Two Variables
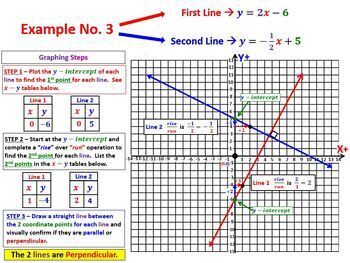
- Lesson 19 - Solving and Graphing Parallel and Perpendicular Lines
- Lesson 20 - Analyzing Linear Functions with an Equation/Graph/Table
This bundle includes a video of each of the above-noted lessons as well as all student worksheets associated with each lesson and video. The native MS Word file of each worksheet is included in the event the teacher desires to modify any aspect of it. In addition a teacher answer key is included for each of lesson worksheets.
The preview file for this product contains each of the student worksheets that are included with each video lesson.
Each of the twenty (20) individual lessons along with the student worksheets and teacher answer keys can be purchased separately under my TpT page if desired. Just type the title of the lesson in the Search Bar on my TpT page to locate these lessons.
The price of this bundle of products is significantly discounted compared to purchasing each video lesson with worksheets individually.
I also have over 350 highly animated products for 6th - 8th Grade General Math, Math 1, Math 2, Math 3, Algebra 1, Algebra 2, Geometry and PreCalculus curriculum topics and these can be reviewed and purchased under my TpT page titled: "Priceless Math".


