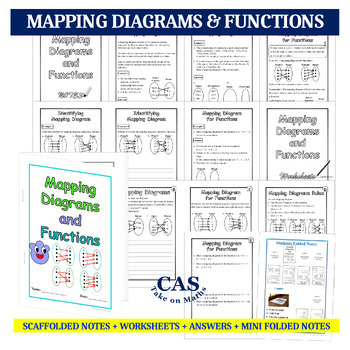
Mapping Diagrams and Functions Workbook
- Zip
Description
MAPPING DIAGRAMS AND FUNCTIONS WORKBOOK
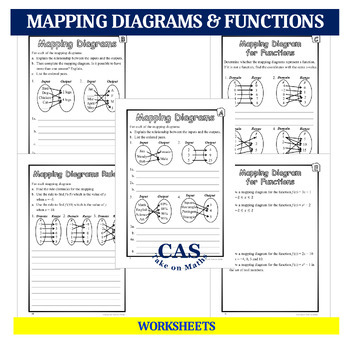
Scaffolded notes + worksheets + solutions + mini folded notes to
learn and practise:
- Understand that a mapping diagram consists of two parallel columns connected by lines or arrows that show the relationship between input and output values.
- Explain the relationship between the inputs and the outputs of mapping diagrams.
- Draw a mapping diagram of the ordered pairs.
- Determine whether the mapping diagrams represent a function.
- Draw a mapping diagram for functions.
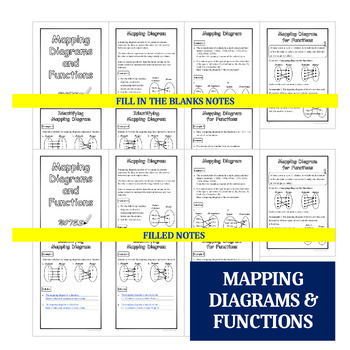
There are two styles of the workbook.
- Style 1: Cover, fill in the blank notes and worksheets
- Style 2: Cover, completed (filled) notes and worksheets
Total pages in each workbook: 14
Easy classroom preparation:
For workbook: Just print and staple all pages together to make a book.
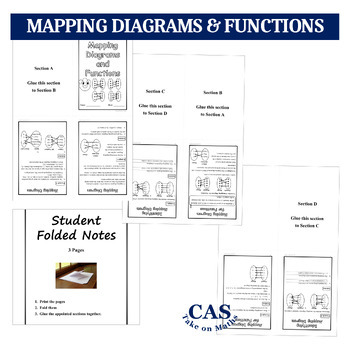
For Mini folded note: print, fold and glue the pages to make a mini
notebook.
Grades: 9th & 12th
Learning Outcomes:
- Define and use a relation as mappings between sets and as a rule or a formula that defines one variable quantity in terms of another.
- Identify types of relations on a given domain and range (ordered pairs) using mapping diagrams.
- Understand that a function is a rule that assigns to each input exactly one output. The graph of a function is the set of ordered pairs consisting of an input and the corresponding output.
Also comply with Australian Curriculum:
Understand the concept of a function as a mapping between sets, and as a rule or a formula that defines one variable quantity in terms of another (ACMMM022)
Use function notation, domain and range, independent and dependent variables (ACMMM023)
Understand the concept of the graph of a function (ACMMM024)
Other products about functions:
- Functions-Classifying and Mapping Relations Workbook
- Asymptotes of Rational Functions Video lesson
- Asymptotes of Rational Functions Worksheets
My other resources:


