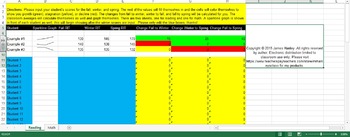
MAP Classroom Graphs **Editable**
MrHanleysClass
11 Followers
Description
This is a ready made graph for both reading and math MAP scores. All you have to do is plug in the students names (up to 35) and their scores (fall, winter, and spring) as the year progress. The spreadsheet will do the rest of the work for you! It will tell you how much progress they have made each time and it will highlight whether it was growth or decline by turning green, red, or yellow. The spreadsheet also will calculate your classroom average and graph it for you over the course of the year as well. This is a great product to dig deep into the data and get a clear picture of how your classroom is doing on the MAP test.
Total Pages
2 pages
Answer Key
Does not apply
Teaching Duration
N/A
Report this resource to TPT
Reported resources will be reviewed by our team. Report this resource to let us know if this resource violates TPT’s content guidelines.


