TPT
Total:
$0.00

Linear Relationships Booklet Project

Rated 4.89 out of 5, based on 18 reviews
4.9 (18 ratings)
;
8th Grade Math Teacher
3k Followers
Grade Levels
8th - 9th
Resource Type
Standards
Formats Included
  • PDF
Pages
4 pages
$2.00
$2.00
Share this resource
Report this resource to TPT
8th Grade Math Teacher
3k Followers

Description

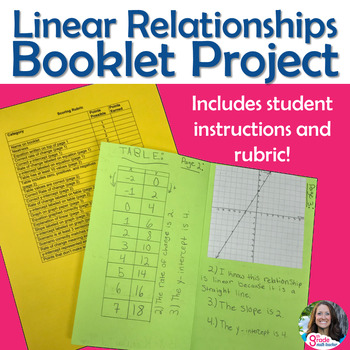
In this mini project, students create a booklet of the multiple representations of a linear relationship. Students are given an equation in slope-intercept form and make a small booklet using their own paper. The equations are included or you can create your own.

Use this booklet project at the end of your linear relationships unit as an assessment or for extra credit. Have your students show what they know about slope and y-intercepts in tables, graphs, equations, and verbal descriptions!


This resource is easy to use! Simply print the instructions and give each student an equation. The resource includes step-by-step directions for students to follow and questions to answer. Examples are also given to help guide students.

Students are asked to:

  • give the slope and y-intercept from the equation
  • create a table and show the slope and y-intercept
  • create a graph and show the slope and y-intercept
  • create a verbal description/scenario to match

Students answer questions about slope and y-intercept in the multiple representations throughout the booklet.

A rubric is included for easy scoring with point values totaling 50.


Differentiate by choosing which equations to give to students. Students who need more help may need an equation without negatives or fractions. You can also make up your own equations to challenge students.

You may also like...

Linear Relationships Poster Set

Slope-Intercept Form Game

Slope from 2 Points Color Page

Functions Guided Notes BUNDLE

Functions Scavenger Hunt Activity

Rate of Change and Initial Value Worksheet

Total Pages
4 pages
Answer Key
Rubric only
Teaching Duration
N/A
Report this resource to TPT
Reported resources will be reviewed by our team. Report this resource to let us know if this resource violates TPT’s content guidelines.

Standards

to see state-specific standards (only available in the US).
Use similar triangles to explain why the slope m is the same between any two distinct points on a non-vertical line in the coordinate plane; derive the equation 𝘺 = 𝘮𝘹 for a line through the origin and the equation 𝘺 = 𝘮𝘹 + 𝘣 for a line intercepting the vertical axis at 𝘣.
Interpret the equation 𝘺 = 𝘮𝘹 + 𝘣 as defining a linear function, whose graph is a straight line; give examples of functions that are not linear. For example, the function 𝘈 = 𝑠² giving the area of a square as a function of its side length is not linear because its graph contains the points (1,1), (2,4) and (3,9), which are not on a straight line.
Construct a function to model a linear relationship between two quantities. Determine the rate of change and initial value of the function from a description of a relationship or from two (𝘹, 𝘺) values, including reading these from a table or from a graph. Interpret the rate of change and initial value of a linear function in terms of the situation it models, and in terms of its graph or a table of values.

Reviews

Questions & Answers