Line Plots with Fractions : Line Plots Mini Lesson Video : Digital
- Zip
Description
Your 4th grade math students will love learning with this video! This “I Solve You Solve” line plots with fractions video mini lesson will help your students gain a better understanding of the following standard: 4.MD.B.4 - Make a line plot to display a data set of measurements in fractions of a unit (1/2, 1/4, 1/8). Solve problems involving addition and subtraction of fractions by using information presented in line plots.
The video and activity in this pack can be used in a variety of ways. You can use it for digital learning as long as everything is uploaded behind a password protected site, such as a school portal where students have to enter passwords or to Google Classroom where students must log in. The video can NOT be uploaded to a public website such as Youtube. The video is intended for one teacher and her classroom. If more than one teacher is going to be using it, please make sure you purchase the correct number of additional licenses.
NOTE: If you are trying to share this on your stream with your kids in Google Classroom, you may find it easier to save the .mp4 to your Google Drive and then upload it straight from your drive. Uploading from your drive is given as an option. The longer the video, the longer it will take to upload. Once it is in your google drive though, it is really fast to share with students.
**** Find other I Solve You Solve videos HERE.
===================================
Please read through the description of this product carefully. If you have any questions or do not understand anything about the product, please do send me a message BEFORE you buy. I want you to be happy with your purchase. This will help ensure that you are getting exactly what you want.
===================================
What is an “I Solve You Solve” lesson? In an “I Solve You Solve” lesson, a problem is presented using the video. The problem is then solved step by step using graphics and narration. Next, a problem is presented to the students for them to solve. When students go to solve their problem, a character is introduced, and students are asked to help the character solve the problem. The character in this video is Sam.
What is included in this line plots with fractions mini lesson activity pack?
- 25 Minute Mini Lesson Video – The video is an Mp4 and it will need to be downloaded and saved to your computer. Please watch the preview video above to get an idea of how things are presented.
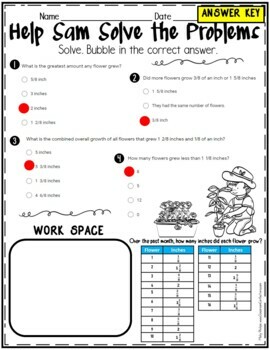
- A pdf file that presents 4 multiple choice questions. Students will be instructed to create a line plot with fractions as part of the “You Solve”. They will use the data presented on the line plot to answer 4 questions. The create the line plot using notebook paper and pencil, but you can print the 4 questions as a .pdf
- BONUS – I have also included the same 4 questions as a Google Form quiz. If you use Google Classroom, you can use the link given in the file to make a copy of the quiz for your class to complete. Students are still directed to draw the line plot on notebook paper. Then they can go to google classroom to complete the questions.
What is presented in the video?
The definitions of line plot and data are given. I then take them step by step though creating a line plot where I plot the number of hours students read over the weekend. The number line is split into fourth in order to plot the data. We use pretend data that I collected from 20 students. I show them how to create the line plot and then we discuss that you can use a line plot to answer questions. After watching how to create a line plot, students are asked to help Sam create a line plot showing his data. Sam is plotting how much his plants grew over one month. Students will use a line plot split into eighths. They will then answer 4 questions about the line plot they create.
How might I use this line plot with fractions activity?
Some suggestions are:
- Upload the line plot video to Google Classroom during digital learning for your students to watch. Then have students complete the 4 questions.
- Project the video in the classroom for the whole class to watch together to introduce a lesson. Continue with other activities for the day. Then have them complete the printable version of the 4 questions.
- Project it to finish out a daily lesson, and then use it as a formative assessment.
- Have students watch and complete as a math center activity.
- Have students watch as their homework and be ready to discuss the next day.
- Use it however you would like with your students, but it may not be posted for public display on the internet.
I hope your students love learning about line plots with fractions. :-)
==========================================
Once again, if there is something you do not understand about the product description, please send me a message before you make a purchase.
**Please....if you ever notice any mistakes, just send me a quick message. I appreciate you allowing me the opportunity to correct things before you rate the product. I can get things corrected in a jiffy, and you can redownload. This might include things like spelling something incorrectly due to a typo, putting an incorrect number, etc. This rarely happens but just in case, I appreciate you giving me then chance to get it corrected for you before you rate the product. Thank you :-)


