Line Plots Range, Median, and Mode Math Smartboard Lesson
Smartboard Smarty
1.7k Followers
Grade Levels
2nd - 5th
Subjects
Resource Type
Formats Included
- NOTEBOOK (SMARTboard) File
Smartboard Smarty
1.7k Followers
Description
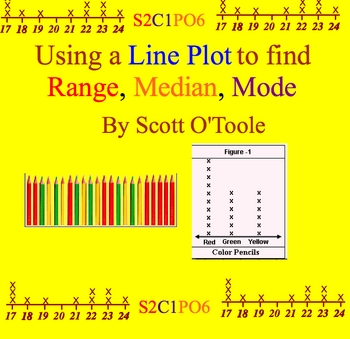
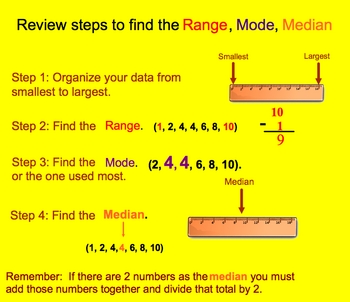
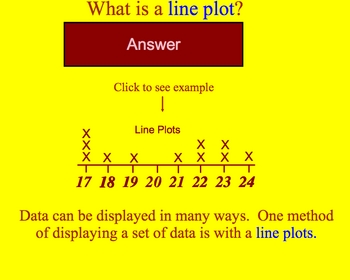
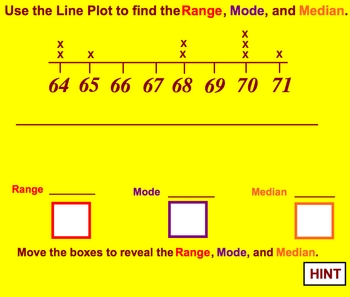
This 17-page math smartboard lesson introduces line plots. The students must use the line plots to find the range, median, and mode of the data presented. This math lesson is made so student come to the board and find the range, median, and mode using line plots. Made by Scott OToole (Scott OToole)
Line plot, Range, Median, Mode Smartboard Lessons, , Math Smartboard interactive lessons, smartboard lesson, lessons for smartboard, smartboard range, median, and mode, line plot smarboard lesson, smartboard activity
Line plot, Range, Median, Mode Smartboard Lessons, , Math Smartboard interactive lessons, smartboard lesson, lessons for smartboard, smartboard range, median, and mode, line plot smarboard lesson, smartboard activity
Total Pages
0 pages
Answer Key
N/A
Teaching Duration
40 minutes
Report this resource to TPT
Reported resources will be reviewed by our team. Report this resource to let us know if this resource violates TPT’s content guidelines.


