Line Plot Graphing Activity Math Centers
- Zip
What educators are saying
Description
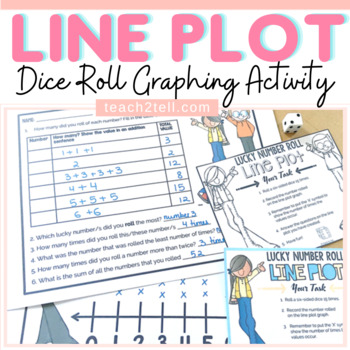
This is a basic line plot graphing activity to introduce recording data on a line plot. A six-sided dice is rolled 15 times and numbers are recorded. A recording sheet interprets data collected.
Items Included
- File folder cover (2 options): if placing all items in a file at a center
- Single large task card (color and blackline) on a sheet outlining the task
- Two small task cards (color and blackline) on a sheet outlining the task
- Line plot sheet to plot data (single- large and two small on a sheet)
- Response Sheet to interpret data (single- large and two small on a sheet)
- Sample Response /Answer Key
Manipulative Needed:
A single six-sided dice.
Activity:
Students will follow the instructions on the task card to collect data and plot it on the line plot. They will then interpret the data collected by answering questions.
* To save on paper, you have the option to print two templates on a single sheet for this activity.
Included In
Further Reading
Line Plot Graphing Made Fun With Dice
Thank you for visiting Teach2Tell. New resources are 50% off - do follow the store to get notified :)
Please contact me with any queries regarding this resource.
Thank you!
Laurane@teach2tell.com


