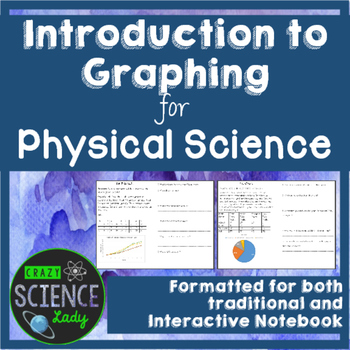
Introduction to Graphing for Physical Science
CrazyScienceLady
6.3k Followers
Grade Levels
7th - 9th, Homeschool
Subjects
Resource Type
Formats Included
- Zip
Pages
15 pages
CrazyScienceLady
6.3k Followers
What educators are saying
This is a great activity if you are going over the 3 main types of graphs. In addition, the resource goes over what type of graph that should be used based on data. So, if you are tired of being asked what type of graph to use, this is your resource:)
Description
This resource serves to introduce 7-9th grade physical science students to graphing in science. Line, bar, and pie charts are introduced. The focus is on WHEN to use each of these graphs, and how the independent and dependent variables relate to each type of graph. Each type of graph is looked at independently. Students questions are provided. Answer keys all included.
I also have provided INB sheets-- they are half of an 8 1/2 by 11 handout. All handouts are provided in both traditional notebooking form and interactive notebook form.
Remember to click the little green star to follow me for updates!
CrazyScienceLady
I also have provided INB sheets-- they are half of an 8 1/2 by 11 handout. All handouts are provided in both traditional notebooking form and interactive notebook form.
Remember to click the little green star to follow me for updates!
CrazyScienceLady
Total Pages
15 pages
Answer Key
Included
Teaching Duration
45 minutes
Last updated Jun 29th, 2016
Report this resource to TPT
Reported resources will be reviewed by our team. Report this resource to let us know if this resource violates TPT’s content guidelines.


