Introduction to Functions Activities Bundle
- Zip
Products in this Bundle (7)
showing 1-5 of 7 products
Description
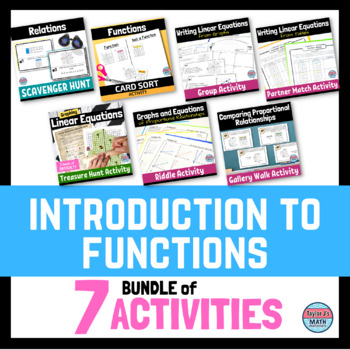
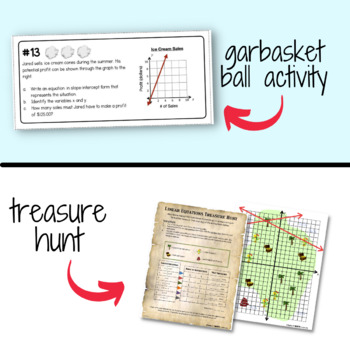
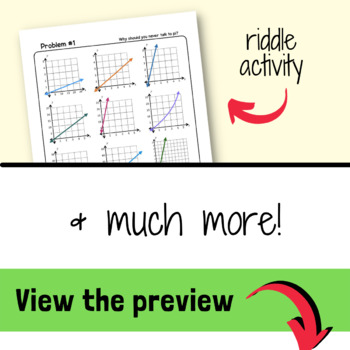
A must-have bundle! These interactive activities cover topics that include relations, functions, writing equations from tables and graphs, graphing linear equations, graphs and equations of proportional relationships and more. Students will work together, move around the room, and even get to throw paper balls into the trash! Get ready to engage your students with these in-class activities!
YOU MIGHT BE INTERESTED IN EACH LESSON:
- Relations: model and describe the relationship between two quantities
- Functions: determine whether a relation is a function from a table or graph
- Writing Linear Equations From Graphs: write a linear equation from a graph in the form of y=mx+b
- Writing Linear Equations From Tables: write a linear equation from a table and graph it
- Graphing Linear Equations: graph a linear equation on the coordinate plane
- Graphs and Equations of Proportional Relationships: identify a proportional relationship from a graph and write the equation in slope-intercept form
- Comparing Proportional Relationships: compare functions with proportional relationships that are displayed as tables, graphs, and equations
- Review Guide and Unit Assessment
CLICK HERE TO VIEW THE FULL UNIT!
*EVEN MORE PRACTICE*
This task card companion set provides 3 levels of practice to help you reach all learners throughout the entire unit! Great for struggling students and early finishers!
*************************************************************************************************************
YOU MIGHT ALSO BE INTERESTED IN:
- these FREEBIES
- Flipped Classroom guided notes, activities, task cards, and lessons
- 7th grade and 8th grade worksheets
FOLLOW ME
Follow my store to receive email updates on new items, product launches, and sales!
I'd really appreciate you rating the item after downloading! PLUS you'll receive credits toward future purchases!
TERMS OF USE
Purchase of this product entitles the purchaser the right to reproduce the pages in limited quantities for single classroom use only. Resources may only be posted online if they are behind a password protected site.
©Taylor J's Math Materials, 2018-present


