Intro to Statistics Bar Graphs
Sandra Balisky
887 Followers
Grade Levels
PreK - 2nd, Homeschool
Subjects
Resource Type
Formats Included
- PDF
Pages
8 pages
Sandra Balisky
887 Followers
Description
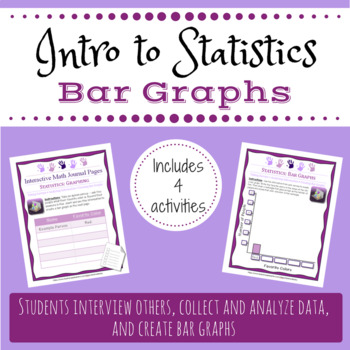
This hands-on activity gives students the opportunity to interview others, collect and analyze data, and create bar graphs to visually represent the information.
This activity can be used in math centers or one-on-one with students (K-2nd grade) to help them practice some basic statistics skills.
A blank chart and bar graph are included to give kids a chance to make up their own survey questions.
See my store for several other Interactive Journal Pages activities for Pre-K-2nd grade math.
Total Pages
8 pages
Answer Key
N/A
Teaching Duration
N/A
Last updated Sep 5th, 2017
Report this resource to TPT
Reported resources will be reviewed by our team. Report this resource to let us know if this resource violates TPT’s content guidelines.


