Interpreting Science Graphs Activity
Shaping The Smiths
65 Followers
Grade Levels
5th - 8th
Subjects
Resource Type
Formats Included
- Word Document File
Pages
27 pages
Shaping The Smiths
65 Followers
Description
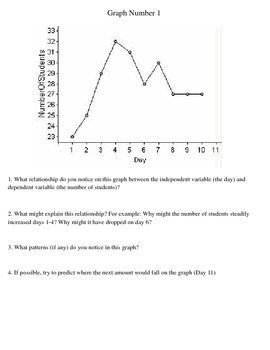
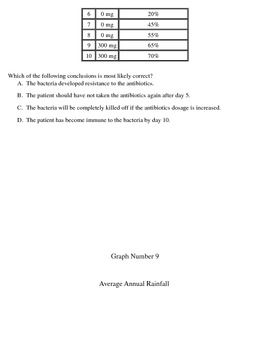
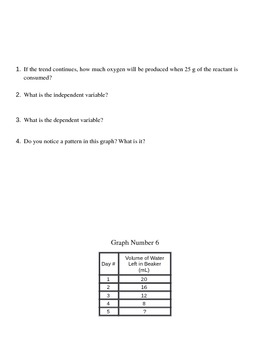
The thumbnails aren't showing up right. Everything will look nice when you download it :) This is a collection of 27 graphs with analyzing questions that correspond with each. In my science classroom, I had each student work on one, and then we rotated, so kids were able to see each graph. I laminated each sheet and had kids write their answers on notebook paper. These questions analyze:
Hypothesis and if they are supported by the data or not
Independent/Dependent variables
Bias
Interpreting graphs
Patterns and trends in data
Predicting the next outcomes
Hypothesis and if they are supported by the data or not
Independent/Dependent variables
Bias
Interpreting graphs
Patterns and trends in data
Predicting the next outcomes
Total Pages
27 pages
Answer Key
Included
Teaching Duration
N/A
Report this resource to TPT
Reported resources will be reviewed by our team. Report this resource to let us know if this resource violates TPT’s content guidelines.


