Immigration - Coming to the United States (Charts and Graphs)
The Gifted Writer
879 Followers
Grade Levels
6th - 12th
Subjects
Resource Type
Standards
CCSSRST.6-8.7
Formats Included
- PDF
Pages
12 pages
The Gifted Writer
879 Followers
Description
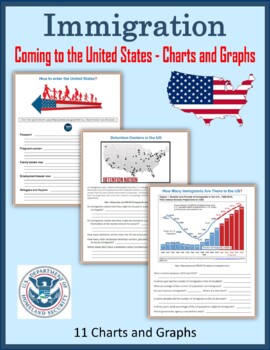
11 pages for students to explore charts and graphs on immigration.
- Unauthorized Residence in the US,
- State by State Immigration Comparison,
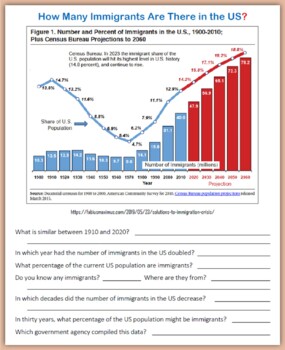
- How Many Immigrants Are There in the US?
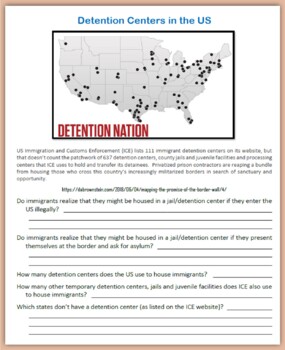
- Detention Centers in the US,
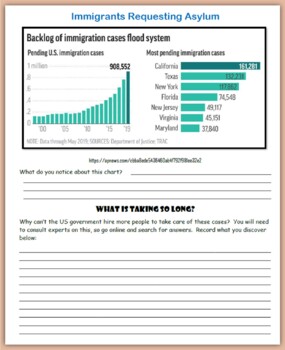
- Immigrants Requesting Asylum,
- Sending Money to Mexico,
- Sending Money to Central America,
- Undocumented Population in the US,
- US Population,
- DACA or Dreamers.
Take a look at the Preview to see sample pages.
Total Pages
12 pages
Answer Key
N/A
Teaching Duration
N/A
Report this resource to TPT
Reported resources will be reviewed by our team. Report this resource to let us know if this resource violates TPT’s content guidelines.
Standards
to see state-specific standards (only available in the US).
CCSSRST.6-8.7
Integrate quantitative or technical information expressed in words in a text with a version of that information expressed visually (e.g., in a flowchart, diagram, model, graph, or table).


