Identifying Slope From a Graph
- Google Drive™ folder
- Internet Activities

Also included in
- Need engaging resources to teach your students how to find slope and y-intercept from a given graph, table and equation. These activity are great for your classrooms math centers, internet activities, warm up, review, independent work, quiz, homework or instructional technology day. Please read descPrice $32.00Original Price $38.00Save $6.00
Description
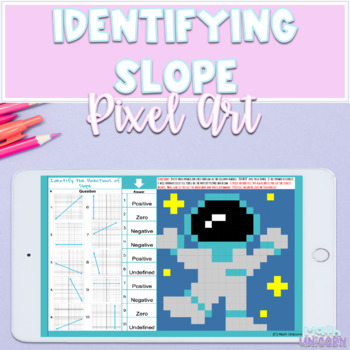
Teach your student how to identify slope from a given graph with this engaging activity! Your student will determine the direction of slope from each given graph by determining if the linear equation graph is positive, negative, zero or undefined in the provided text boxes space. Your students will solve 10 questions by looking at the photos in the cell and enter their responses in the provided space. As they answer correctly pieces of a mystery picture will begin to appear. By the end, they will have created an astronaut! This activity is also great for your classrooms math centers, internet activities, warm up, independent work, quiz, homework or instructional technology day.
This resource is create in Google. You will receive a folder with the student copy, answer key, terms of use and credits.
You may also like this resource:
- Y-Intercept From a Graph | Digital & Printable | Distance Learning
- Finding Slope From Two Given Points | Pixel Art
- Identify Slope from a Graph | Pixel Art
- Identify Slope within an Equation | Pixel Art
- Identify Slope From a Graph | Drag & Drop Activity
Get FREE TPT credit to use on future purchases!
- Head on over to your "My Purchases" page. Look at each one of the fantastic products you've purchased from incredible TPT educators and click on "Provide Feedback"!
- Write a short comment to the seller about their product (be honest but fair) and use the "star ratings" to grade the product! After you submit, you will then receive TPT credits in your account!
- Take it one step further! Look for the green star next to my store log and click it to become a follower! You will now receive email updates about my store.
Licensing Terms:
By purchasing this product, you own a license for ONE TEACHER ONLY for personal use in their own classroom. Licenses are non-transferable and therefore can NOT be passed from one teacher to another. No part of this resource is to be shared with colleagues or used by an entire team, grade level, school or district without purchasing the correct number of licenses.


