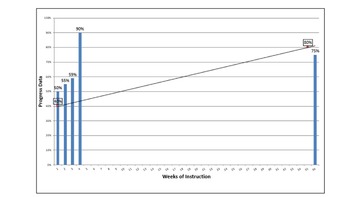
IEP Progress Monitoring Weekly Graph - Special Education / RTI
Robin Meissner
52 Followers
Grade Levels
PreK - 12th, Staff
Resource Type
Formats Included
- XLSX
Pages
1 page
Robin Meissner
52 Followers
Description
You will use this forever more!
Easily visualize progress!
User-friendly!
See also IEP Progress Monitoring - Monthly Graph
Video Directions for Monthly graph here (will be helpful for this graph):
https://www.teacherspayteachers.com/Product/Video-Instructions-Special-Ed-IEP-Weekly-Progress-Monitoring-Chart-2394833
Or on Youtube for Monthly graph here:
https://www.youtube.com/watch?v=500D-wghySI
This is a weekly progress monitoring data collection tool/graph, especially for special education teachers and tracking Response to Intervention data. Enter weekly data for each IEP goal, baseline data, and the goal criteria. The Excel spreadsheet creates an easy to read bar chart with an aim line. Share with parents and students to communicate progress simply!
Thanks for looking!
The Special Ed. Helper
Total Pages
1 page
Answer Key
N/A
Teaching Duration
N/A
Report this resource to TPT
Reported resources will be reviewed by our team. Report this resource to let us know if this resource violates TPT’s content guidelines.


