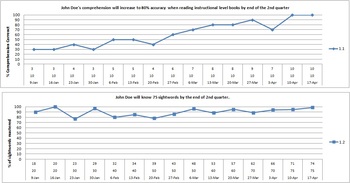
IEP Data Tracker with graphs
Vance Sims
56 Followers
Description
This Excel spreadsheet is set up to handle up to 7 Annual Goals and 8 objectives under each. It is based on percentage of trials attempted. On the second worksheet, a graph is created for each short-term objective. There is room for 14 different trials in grading period. As the chart is populated, the graph is also, including text. If you purchase this item, I can send you the instructions, but all you have to do is enter the dates of your trials, the number of trials and the number correct from the trials. The data is graphed on the second worksheet.
Total Pages
2 pages
Answer Key
N/A
Teaching Duration
3 months
Report this resource to TPT
Reported resources will be reviewed by our team. Report this resource to let us know if this resource violates TPT’s content guidelines.


