TPT
Total:
$0.00

Human Population Graphing Activity

Rated 4.65 out of 5, based on 26 reviews
4.7 (26 ratings)
;
Kimberly Frazier
255 Followers
Grade Levels
5th - 8th
Standards
Formats Included
  • PDF
Pages
5 pages
$1.00
$1.00
Share this resource
Report this resource to TPT
Kimberly Frazier
255 Followers
Easel Activity Included
This resource includes a ready-to-use interactive activity students can complete on any device.  Easel by TPT is free to use! Learn more.

Description

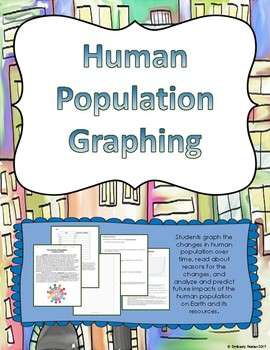
Students graph the human population over time. Included is a short reading about reasons the human population has increased (written for students below 6th grade reading level to comprehend) as well as analysis or discussion questions for after the graph is created.

This activity is meant to help students understand that the human population is rapidly growing that that this has an effect on our resources, as well as practice in graphing and graph interpretation and analysis. This addresses the following standards:

NGSS-MS-ESS3-4: Construct an argument supported by evidence for how increases in human population and per-capita consumption of natural resources impact Earth's systems.

CCSS Math Standard CCSS.MATH.CONTENT.5.G.A.2: Graph points on the coordinate plane to solve real-world and mathematical problems.

I use this activity with my 6th grade students in our "Earth and Human Activity" Unit. Also included is a Teacher's Resource page with what the graph should look like and answers to the analysis questions.

Key Vocabulary: population, growth rate, exponential growth, natural resources, resource depletion, population dynamics, carrying capacity, graphing, Earth systems

Total Pages
5 pages
Answer Key
Included
Teaching Duration
1 hour
Last updated Feb 2nd, 2019
Report this resource to TPT
Reported resources will be reviewed by our team. Report this resource to let us know if this resource violates TPT’s content guidelines.

Standards

to see state-specific standards (only available in the US).
Use a pair of perpendicular number lines, called axes, to define a coordinate system, with the intersection of the lines (the origin) arranged to coincide with the 0 on each line and a given point in the plane located by using an ordered pair of numbers, called its coordinates. Understand that the first number indicates how far to travel from the origin in the direction of one axis, and the second number indicates how far to travel in the direction of the second axis, with the convention that the names of the two axes and the coordinates correspond (e.g., 𝘹-axis and 𝘹-coordinate, 𝘺-axis and 𝘺-coordinate).

Reviews

Questions & Answers

255 Followers