How the Grinch Stole Christmas Systems of Equations
Get Your Math Together
12 Followers
Grade Levels
8th - 9th
Subjects
Resource Type
Standards
CCSS8.F.A.1
CCSS8.F.A.2
CCSS8.F.A.3
CCSS8.F.B.4
CCSS8.F.B.5
Formats Included
- PDF
Pages
8 pages
Get Your Math Together
12 Followers
Description
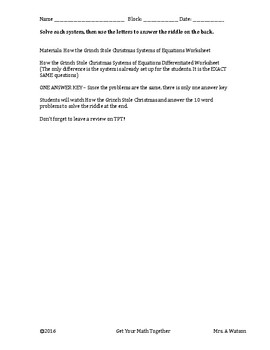
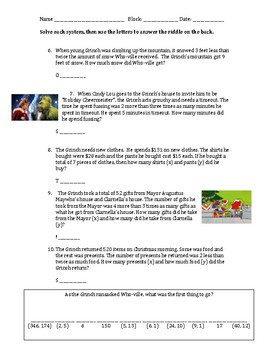
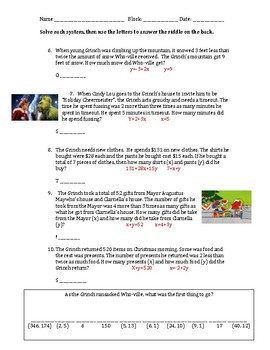
Students will watch How the Grinch Stole Christmas and answer 10 systems of equations. Included is a regular worksheet, a differentiated worksheet (with the systems set up for the students, IT IS THE EXACT SAME QUESTIONS), and ONE answer key that works for BOTH worksheets.
Once students answer the questions, they will use the letters to solve the riddle at the end.
Once students answer the questions, they will use the letters to solve the riddle at the end.
Total Pages
8 pages
Answer Key
Included
Teaching Duration
90 minutes
Report this resource to TPT
Reported resources will be reviewed by our team. Report this resource to let us know if this resource violates TPT’s content guidelines.
Standards
to see state-specific standards (only available in the US).
CCSS8.F.A.1
Understand that a function is a rule that assigns to each input exactly one output. The graph of a function is the set of ordered pairs consisting of an input and the corresponding output.
CCSS8.F.A.2
Compare properties of two functions each represented in a different way (algebraically, graphically, numerically in tables, or by verbal descriptions). For example, given a linear function represented by a table of values and a linear function represented by an algebraic expression, determine which function has the greater rate of change.
CCSS8.F.A.3
Interpret the equation 𝘺 = 𝘮𝘹 + 𝘣 as defining a linear function, whose graph is a straight line; give examples of functions that are not linear. For example, the function 𝘈 = 𝑠² giving the area of a square as a function of its side length is not linear because its graph contains the points (1,1), (2,4) and (3,9), which are not on a straight line.
CCSS8.F.B.4
Construct a function to model a linear relationship between two quantities. Determine the rate of change and initial value of the function from a description of a relationship or from two (𝘹, 𝘺) values, including reading these from a table or from a graph. Interpret the rate of change and initial value of a linear function in terms of the situation it models, and in terms of its graph or a table of values.
CCSS8.F.B.5
Describe qualitatively the functional relationship between two quantities by analyzing a graph (e.g., where the function is increasing or decreasing, linear or nonlinear). Sketch a graph that exhibits the qualitative features of a function that has been described verbally.


