- PDF
Description
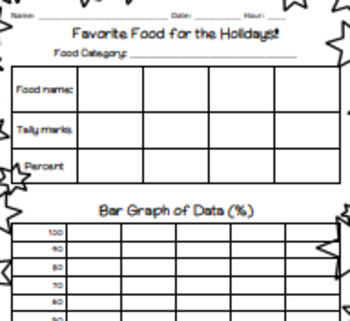
This product is designed to be an interactive assignment for the whole class, although variations may be made. The product includes a table listed the most favored foods at holiday times. The students are to each vote on their favorite food out of the choice, and the choices are tallied for each food. The tallies are combined for each choice and the percentage of students preferring each food are determined. The percentage of students preferring each food of the five are also determined as a class or as individuals. The results are entered into a bar graph to show the percent of students that preferred each type of dish.
To fill in their graph, the students may use markers, crayons, or colored pencils for the bar graphs. Alternatively, if the teacher prefers not to include markers, colored pencils, and crayons, the teacher may use the designs to be used to fill different columns in the bar chart.
These bar charts look nicely posted on the walls or bulletin boards.


