
Histograms - Maths GCSE ActivInspire Lesson

- Flipchart File
Also included in
 Bundle of 20 maths GCSE lessons on probability and data representation.ActivInspire format included.All lessons have examples fully written out, MWB or learning check, at least one task and a challenge task. Remove orange squares to reveal answers.Lessons included in this bundle:FoundationAverages (Price $25.00Original Price $30.00Save $5.00
 Bundle of 160 mathematics GCSE lessons on number, algebra, geometry, and probability & data representation.ActivInspire format included.All lessons have examples fully written out, MWB or learning check, at least one task and a challenge task. Remove orange squares to reveal answers.Number lessoPrice $160.00Original Price $241.00Save $81.00
Description
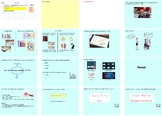
Maths GCSE lesson on histograms. Includes both interpreting information from and drawing histograms.
Lesson structure includes examples, MWB section, one task and a challenge task. Challenge task is on finding the median, LQ and mean from a histogram.
ActivInspire format included.
Take back hours of your time and still deliver an excellent lesson!
Lesson benefits include:
- Engage a love of learning by discussion of how the maths applies in real life
- Set high expectations of presentation with starter slide
- Examples clearly written out (can be used as a revision tool for pupils who were absent)
- Lessons are scaffolded to reach all learners; gradually increase in difficulty
- Solutions for every question
- Lesson slides kept simple to prevent cognitive overload
All lessons designed by a GCSE/A-level maths teacher with a degree in mathematics
