TPT
Total:
$0.00

Halloween/Fall Data & Graphing: Bar Graphs, Picture Graphs, Tally Charts

Rated 5 out of 5, based on 2 reviews
5.0 (2 ratings)
;
Enhance SEL
576 Followers
Grade Levels
2nd - 3rd
Standards
Formats Included
  • PDF
Pages
7 pages
$3.00
$3.00
Share this resource
Report this resource to TPT
Enhance SEL
576 Followers

Description

Halloween & Fall related Data and Graphing Activities

2nd and 3rd Grade Graphing Worksheets

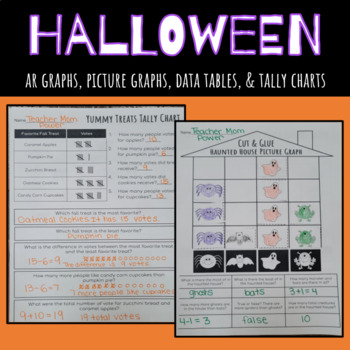
1. Yummy Treats Tally Chart: Use a tally chart to create a bar graph and then answer questions

2. Pumpkin Patch Bar Graph: Use given data to make a bar graph and analyze data to answer questions

3. Sweet Tooth Picture Graph: each monster represents 2 votes. Analyze the picture graph to answer questions regarding the most favorite or least favorite monster candy.

4. 2 pages of Count, Graph, and Color

5. Cut and Glue haunted house pictures to make a picture graph and answer questions

Google Classroom Grammar Activities

Nouns Digital Google Classroom Grammar Activities

Verbs Digital Google Classroom Grammar Activities

Adjectives Digital Google Classroom Grammar Activities

Digital Adverbs Activities

Grammar Parts of Speech Posters

More Google Classroom Resources Below! Click and Preview!

Digital Second Grade Place Value Intro

Digital Place Value: Count within 1000; Skip Count

Digital Place Value: Read and Write Number to 1000

Digital Compare 3 Digit Numbers

Digital 2nd Grade Geometry

Total Pages
7 pages
Answer Key
Does not apply
Teaching Duration
1 Week
Report this resource to TPT
Reported resources will be reviewed by our team. Report this resource to let us know if this resource violates TPT’s content guidelines.

Standards

to see state-specific standards (only available in the US).
Draw a picture graph and a bar graph (with single-unit scale) to represent a data set with up to four categories. Solve simple put-together, take-apart, and compare problems using information presented in a bar graph.
Draw a scaled picture graph and a scaled bar graph to represent a data set with several categories. Solve one- and two-step “how many more” and “how many less” problems using information presented in scaled bar graphs. For example, draw a bar graph in which each square in the bar graph might represent 5 pets.

Reviews

Questions & Answers

576 Followers