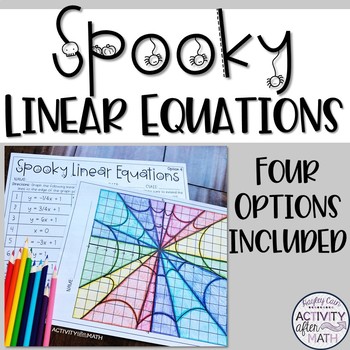
Halloween Math Graphing Linear Equations Spiderwebs
- PDF
What educators are saying
Description
This is a great holiday math activity where students graph linear equations to create Spooky Spiderwebs! There are four options to choose from making this a great differentiated Halloween Activity for your secondary math class!
This resource includes:
FOUR STUDENT OPTIONS:
•Option 1: 1st Quadrant with the origin as the y-intercept
•Option 2: 1st Quadrant with varying y-intercepts
•Option 3: Four Quadrants with varying y-intercepts
•Option 4: Four Quadrants with 1 as the y-intercept
• Teacher Instructions
Each spiderweb consists of student directions, a blank graph, a blank graph with inner webs for guidance, a completed graphed line example, a completed web design using the given inner webs, and a colored picture for reference.
Options for using this resource
This makes a great Halloween Graphing Activity, Early Finisher, Sub plans, filler activity or graphing linear equations review activity.
It is easy to print the instructions on one side and the graph on the back to save paper! Use all four different graphs to create an awesome bulletin board display, cut the spiderwebs out and create a spiderweb banner, or hang them around the school in wall corners or windows!
You might also be interested in these other Halloween resources:
Math Movie Questions to accompany the movie Coco
Math Movie Questions to accompany the movie Monsters, Inc.
Skeleton Coordinate Graphing Picture
Math Movie Questions to accompany the movie Maleficent
Witch Coordinate Graphing Picture
Operations with Scientific Notation Coloring Activity
Don't forget that leaving feedback earns you points toward FREE TPT purchases
© Hayley Cain (Activity After Math) Please note - this resource is for use by one teacher only. Additional teachers must purchase their own license. If you are interested in purchasing several licenses, please contact me. Thank you for your feedback and Happy Teaching!
activityaftermath@gmail.com
★Let's be Social


