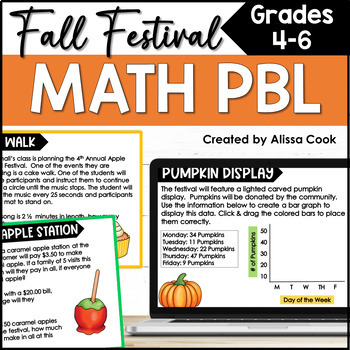
Halloween Digital Math Activities | Fall Festival Math PBL | Google Classroom
Delightful Designs- Alissa Cook
392 Followers
Grade Levels
3rd - 6th
Subjects
Resource Type
Standards
CCSS3.MD.A.1
CCSS3.MD.B.3
CCSS4.MD.A.1
CCSS4.MD.A.2
CCSS5.MD.A.1
Formats Included
- Google Slides™
Pages
8 pages
Delightful Designs- Alissa Cook
392 Followers

Made for Google Drive™
This resource can be used by students on Google Drive or Google Classroom. To access this resource, you’ll need to allow TPT to add it to your Google Drive. See our FAQ and Privacy Policy for more information.
Description
Halloween week can be chaotic and stressful! Make your life easier and your students time more productive with this engaging, interactive math project! Project-based learning activities help students practice vital problem solving and critical thinking skills, all while having so much fun! This creative, high-interest "Fall Festival" Activity can be assigned in Google Classroom for a no-prep solution for Halloween learning! Includes a Google Slides format which can be downloaded as a PDF for a printable option!
Activities Included:
- Cake Walk
- Caramel Apple Station
- Hot Cocoa Stand
- Pumpkin Display
- Pie Eating Contest
A Teacher's Guide and Answer Key are also included!
Math Skills Practiced Include:
- Fraction Operations
- Decimal Operations
- Measurement & Data
- Problem Solving and Critical Thinking
Need more digital activities? Follow Delightful Designs for engaging resources for grades 4-8!
Total Pages
8 pages
Answer Key
Included
Teaching Duration
1 Week
Last updated Oct 3rd, 2021
Report this resource to TPT
Reported resources will be reviewed by our team. Report this resource to let us know if this resource violates TPT’s content guidelines.
Standards
to see state-specific standards (only available in the US).
CCSS3.MD.A.1
Tell and write time to the nearest minute and measure time intervals in minutes. Solve word problems involving addition and subtraction of time intervals in minutes, e.g., by representing the problem on a number line diagram.
CCSS3.MD.B.3
Draw a scaled picture graph and a scaled bar graph to represent a data set with several categories. Solve one- and two-step “how many more” and “how many less” problems using information presented in scaled bar graphs. For example, draw a bar graph in which each square in the bar graph might represent 5 pets.
CCSS4.MD.A.1
Know relative sizes of measurement units within one system of units including km, m, cm; kg, g; lb, oz.; l, ml; hr, min, sec. Within a single system of measurement, express measurements in a larger unit in terms of a smaller unit. Record measurement equivalents in a two-column table. For example, know that 1 ft is 12 times as long as 1 in. Express the length of a 4 ft snake as 48 in. Generate a conversion table for feet and inches listing the number pairs (1, 12), (2, 24), (3, 36),...
CCSS4.MD.A.2
Use the four operations to solve word problems involving distances, intervals of time, liquid volumes, masses of objects, and money, including problems involving simple fractions or decimals, and problems that require expressing measurements given in a larger unit in terms of a smaller unit. Represent measurement quantities using diagrams such as number line diagrams that feature a measurement scale.
CCSS5.MD.A.1
Convert among different-sized standard measurement units within a given measurement system (e.g., convert 5 cm to 0.05 m), and use these conversions in solving multi-step, real world problems.


