HALLOWEEN GRAPHING bar graphs & picture graphs MATH CENTER ACTIVITY
What educators are saying
Description
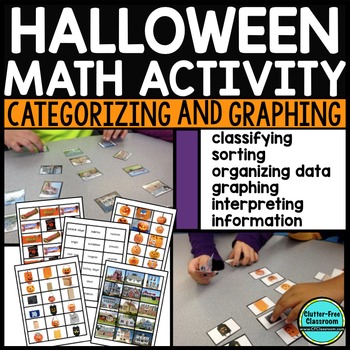
These Halloween Data Categorizing and Graphing Activities are aligned to the Common Core and designed as task cards to be used as a math center or early finishers task to help develop the knowledge of data, sorting, graphing, classifying, categorizing and interpreting data.
WHAT IS INCLUDED
✔ 3 sorting maps that have 2, 3 and 4 categories
✔ 5 sets of sorting cards for students to categorize and sort (Halloween Costumes, Houses We Trick or Treated At, Things to Collect Candy In, Candy/Treats, Pumpkins)
✔ center table tents that have directions on them for students
✔ 2 sets of task cards (8 to use with any graph and 8 to use for advanced students to create picture graphs (pictographs) and bar graphs
✔ recording sheets that are great for holding students accountable during centers (or you could laminate them or insert them into page protectors and have students use dry erase markers)
✔ answer key to make grading quick and easy
5 REASONS TEACHERS LOVE THIS HALLOWEEN MATH RESOURCE
► Students love holiday activities so they'll be engaged in the learning experience.
► They were designed to save teachers time! You will be able to download, print, cut the cards and have an entire math center ready to go in under 3 minutes!! It doesn't get any easy than that to prepare a quality, Common Core aligned, engaging math center!
► They can be used as a guided math center.
► It is aligned with the following Common Core standards: K.MD.B.3, 1.MD.C.4, 2.MD.D.10, and 3.MD.B.3, so you can differentiate within your classroom and continue to use the resource if you get moved to another grade level.
► They are a fun way to celebrate Halloween with your class.
VISIT OUR LET'S GET CONNECTED PAGE TO CHOOSE FROM . . .
◼️THE EMAIL CLUB → weekly freebies
◼️FACEBOOK GROUP → a supportive community of elementary teachers
◼️THE TPT STORE → new resources 50% off
◼️THE BLOG → teaching tips and ideas
◼️INSTAGRAM → a look behind the scenes


