Guided Notes - Box Plots (Student & Teacher Versions)
- Word Document File
Also included in
- This MS Word file is a bundle of 6 separate Guided Notes documents that review both the concept and steps involved in various statistical measures, plots and diagrams. The following Guided Notes documents are included in this bundle:Box PlotsLine PlotsHistogramsMeasures of Central TendencyScatterplPrice $9.50Original Price $12.50Save $3.00
Description
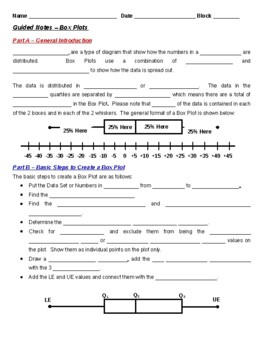
This MS Word file is a Guided Notes document that reviews both the concept and steps involved in solving and producing Box Plots. I use these notes with my Math 1, Math 2 and Algebra 1 students immediately after I introduce this concept with my PPT presentation slidepack on the same subject. It is 2 full pages of notes for the students to complete and includes the detailed steps that I teach my students to use to solve and produce Box Plots. The 3rd page includes an example problem that is worked out in detail for the students using the listed solution steps. The 4th and last page includes 1 additional practice problem for the students to solve using the steps listed in the Guided Notes. Please note that this Guided Notes package addresses the steps to produce a Box Plot "manually", i.e. without a graphing calculator. The 4-page companion teacher answer key document is also included. The native MS Word file is included in the event the teacher wants to modify the document to suit his or her purposes in the classroom.
Similar Guided Notes products as well as over 100 highly animated, MS PowerPoint presentation slidepacks for the Math 1, Math 2, Math 3, Algebra 1, Algebra 2, Geometry and PreCalculus curriculum topics can be reviewed and purchased under my TpT page titled: "Priceless Math".


