TPT
Total:
$0.00

Graphing and Data Bundle

Rated 4.86 out of 5, based on 37 reviews
4.9 (37 ratings)
;
Teaching With a Mountain View
103.4k Followers
Grade Levels
3rd - 5th, Homeschool
Subjects
Resource Type
Standards
Formats Included
  • Zip
  • Google Apps™
Pages
85 plus digital slides
$9.49
List Price:
$12.78
You Save:
$3.29
Bundle
$9.49
List Price:
$12.78
You Save:
$3.29
Bundle
Share this resource
Report this resource to TPT
Teaching With a Mountain View
103.4k Followers
Includes Google Apps™
This bundle contains one or more resources with Google apps (e.g. docs, slides, etc.).

What educators are saying

Great math resource! I used this with my bilingual and ESL students. I can teach them the language of math and practice basic skills.
This is a great resource to implement within small groups for students. It was easy to prep and implement.

Products in this Bundle (4)

    Description

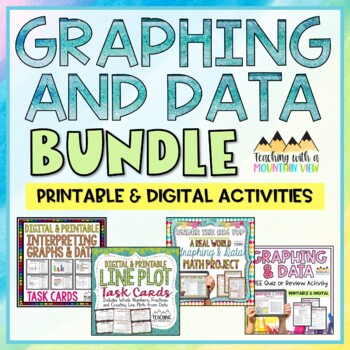
    Think critically about graphs and data with this set of ENGAGING and RIGOROUS resources for upper elementary math. Help your students learn to interpret a variety of graphs, line plots, and data sets with these hands-on activities, math projects, and task card sets that are perfect for differentiating your math instruction. 

    Which resources are included in this graphing and data bundle?

    1. ‘Under the Big Top’, a Graphing and Data Math Project
    2. Line Plot Math Task Cards
    3. Graphing and Data Math Task Cards
    4. Graphing and Data Quiz or Review Activity

    Why Use Task Cards?

    This bundle includes TWO engaging sets of math task cards. Task cards are the perfect way to get hands-on with learning! Unlike traditional worksheets, task cards allow students to get moving! Place task cards around the room (or outside!) and set your students free to move while they cover important educational standards. Task cards are also the perfect tool for differentiation - just pick the card(s) that each student needs to work on the most. Too difficult? Leave it out. Too easy? Choose a more challenging card!

    Total Pages
    85 plus digital slides
    Answer Key
    Included
    Teaching Duration
    N/A
    Report this resource to TPT
    Reported resources will be reviewed by our team. Report this resource to let us know if this resource violates TPT’s content guidelines.

    Standards

    to see state-specific standards (only available in the US).
    Draw a scaled picture graph and a scaled bar graph to represent a data set with several categories. Solve one- and two-step “how many more” and “how many less” problems using information presented in scaled bar graphs. For example, draw a bar graph in which each square in the bar graph might represent 5 pets.
    Generate measurement data by measuring lengths using rulers marked with halves and fourths of an inch. Show the data by making a line plot, where the horizontal scale is marked off in appropriate units-whole numbers, halves, or quarters.
    Make a line plot to display a data set of measurements in fractions of a unit (1/2, 1/4, 1/8). Solve problems involving addition and subtraction of fractions by using information presented in line plots. For example, from a line plot find and interpret the difference in length between the longest and shortest specimens in an insect collection.
    Make a line plot to display a data set of measurements in fractions of a unit (1/2, 1/4, 1/8). Use operations on fractions for this grade to solve problems involving information presented in line plots. For example, given different measurements of liquid in identical beakers, find the amount of liquid each beaker would contain if the total amount in all the beakers were redistributed equally.

    Reviews

    Questions & Answers