Graphing Project Data Analysis Great White Shark Bar Graph Pie Chart Scatterplot
- PDF
- Google Apps™
- Internet Activities

What educators are saying
Also included in
- Looking for fun and engaging ways to teach your students the foundational practices of science, measuring, and the laboratory that will guide them through the year in your class?This bundle contains over 20 activities to help you teach:lab safetylab equipmentclaim-evidence-reasoning (CER)scientificPrice $47.00Original Price $58.97Save $11.97
Description
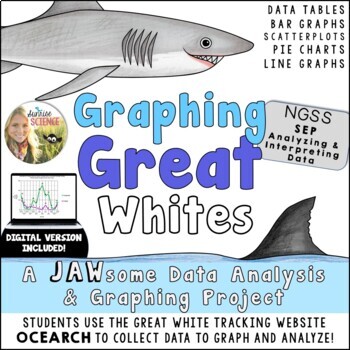
What kid isn’t fascinated by the mysterious and terrifying Great White Shark?! This paper OR digital graphing activity will get your students involved in graphing real data from the amazing website Ocearch! Students will learn about 4 different types of graphs–- bar graphs, scatterplots, pie charts, and line graphs–- and they will create 5 different graphs and analyze them using data they collect from the Ocearch database.
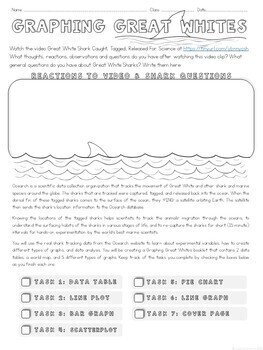
Ocearch is a scientific data collection organization that tracks the movement of Great White and other shark and marine species around the globe. The sharks that are tracked were captured, tagged, and released back into the ocean. When the dorsal fin of these tagged sharks comes to the surface of the ocean, they ‘PING’ a satellite orbiting Earth. The satellite then sends the shark’s location information to the Ocearch database.
Your students will be collecting their own data about the name, age, length, weight, and location of many enormous Great Whites.
The activity begins with a ‘hook’ video clip that shows marine scientists capturing and tagging Mary Lee, the famous Great White who is now around 16 feet (5 meters) long and 3500 pounds (1588 kg)! The students will be totally hooked by seeing the size of this animal and the passion and courage that is required to be a part of a Great White-tagging team! The students will have a chance to write down their reflections and questions after viewing this video clip.
This activity will take about 7 to 10 40-minute class periods, but it can be used in different ways depending on your students. It can be chunked and facilitated as a whole-class lesson series, it can be used over the course of time (perhaps completing one graph per week), or it can be completely self-paced by the students themselves. The Graphing Information Packet can be given to the students as a hard copy packet or in digital form (Google Slides).
A completely editable, digital Google Docs version of this project is now included -- perfect for hybrid or distance learning! You will receive a digital project outline and 9 complete lesson documents each of which you can share with your students on Google Classroom. For this version, students learn how to make digital graphs and the lessons walk students through the steps to create each graph. Students create a digital Google Slides presentation (template included) to showcase their graphs, analyses, and shark research.
I have also included sample data tables with actual shark information for 30 Great Whites. If you are low on time, you can have students choose sharks from the sample data tables! These are also good for checking students' conversions from Imperial to metric units.
Student directions and a grading rubric are provided, as well as three different enrichment and/or early finisher activities that include: graphing vocabulary squares, a Great White webquest, and a Great White One-Pager assignment. Please view the preview for visuals of all of this!
This project teaches students skills to support NGSS Science and Engineering Practice Analyzing and Interpreting Data: Once collected, data must be presented in a form that can reveal any patterns and relationships and that allows results to be communicated to others. Because raw data as such have little meaning, a major practice of scientists is to organize and interpret data through tabulating, graphing, or statistical analysis. Such analysis can bring out the meaning of data—and their relevance—so that they may be used as evidence.)
You may also be interested in these resources:
Experimental Design & Scientific Method Cornell Doodle Notes and Powerpoint
Scientific Procedure Writing Practice Using Building Blocks
Thanks for looking!
Sunrise Science


