Graphing | Project Based Learning | 2nd and 3rd Grade Math
- PDF
Description
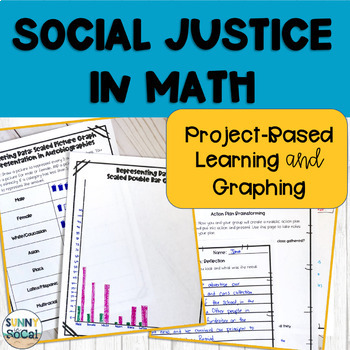
Use graphing skills to analyze representation in your library and connect social justice to your math classroom in a real way through this project-based learning resource.
Students will gather data about the biographies and autobiographies in your library (this can be your school library, classroom library, public library, or home library) and how diverse the representation is among those books.
Students will:
- Gather data
- Create graphs (tally graphs, picture graphs, bar graphs, and scaled graphs)
- Analyze the data
- Create an action plan using their data
- Follow through on their action plans, bringing their learning to life!
- Present their action plans and results to the class (incorporating speaking and listening)
- Write a reflection at the end of the process
- Participate in discussion pre and post data-gathering and analyzing.
These elements help make this a true cross-curricular, project-based learning resource.
This resource includes a set of 2nd grade specific graphs, 3rd grade specific graphs, and a set of editable graphs.
Students will identify what actionable steps they want to take after collecting, graphing, and analyzing the data. This is very open-ended because students should create their own ideas to take ownership of the project. You can have students work on their action plans individually or in small groups, but I'd caution against doing one whole class project because it will be difficult for each student to have a meaningful, actionable role in a large group.


