Graphing Nutrition: A Healthy Foods SMARTboard Math Activity
Julie Masson
180 Followers
Description
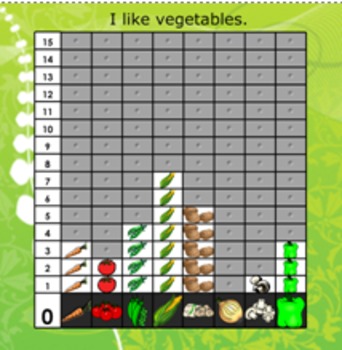
With this interactive SMARTboard math activity, students tap to indicate their favourite food from each food group. Vegetables, fruits, meats and meat substitutes, milk products and grains are the groups represented. When students tap one of the gray squares above their preferred food, the gray box disappears and their food choice is revealed .After the class has all had their turn, students can analyse the data to see which is the favourite of the class, which is the least favourite or which are liked more than another. This notebook can be used for attendance or during class time. It is a perfect health activity for Nutrition Month!
Total Pages
7 pages
Answer Key
N/A
Teaching Duration
N/A
Report this resource to TPT
Reported resources will be reviewed by our team. Report this resource to let us know if this resource violates TPT’s content guidelines.


