
Graphing Nonlinear Systems of Equations~Linear~Quadratic~Activity


- PDF
What educators are saying
Also included in
 All My Algebra Activities. Over 40 Activities (many with multiple levels). Over 200 Walls That Teach. Walk-Around Activities - Domino Like Matching - Sorts - Interactive Bulletin Board Ideas - Practice SheetsActivities Covers:*Absolute Value Functions (1 and 2 variables) - solving - evaluating -Price $200.00Original Price $259.20Save $59.20
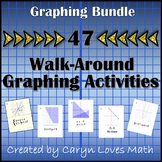 52 Walk Around Graphing Activities Great for Algebra and PreCalc ClassesAbsolute Values FunctionsCube Root FunctionsCirclesLinear InequalitiesLinear Equations (Any form, Point Slope Form, a Point and Slope, Slope-Intercept Form, Vertical/Horizontal Lines)Logarithmic FunctionsExponential FunctionsNonPrice $70.00Original Price $104.50Save $34.50
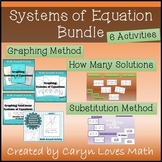 6 Systems of Equations Activities This package includes the following activities Walk Around Activity - Graphing Systems of Equations **All problems have solutions. ** Includes 2 Version (10 and 5 card sets) **Student Response Pages for students to graph their equations ** Answer Key ** Absent StPrice $7.35Original Price $10.50Save $3.15
 That's right. All my math items (Algebra ~ Geometry). That's over a $100 savings from purchasing everything individually.I have noticed many teachers are buying multiple items in my store so to save you time AND money. Everything Math for sale in my store is included in this one product. This prPrice $280.00Original Price $403.20Save $123.20
Description
This activity is designed to help students with solving nonlinear systems of equations by graphing (or with writing them).
This activity also gets students up and about. Place the 12 cards on the wall around your room. Students pick any card to begin with. They should graph the functions on the bottom of the page. After graphing on their own paper, students look around the room for a graph that matches theirs. Then they graph the next problem. They should continue until they return to the card they started with.
Option 2: Have the student start with the graph and write a system of equations to match the graph. Then continue until they return to the card they started with. Remember to specify the form you want the equation in (all the equations are in standard form).
Included are 2 versions of this activity.
• One with 12 cards for use as a walk-around activity (includes an absent student version with all the graphs printed on 2 pages)
• A shorter version with only 6 cards great for table work, bell work or use as a review
To help with grading, I have included 2 student answer sheets: One that includes graph paper, and another with just boxes.
Possible Uses
- Mid-Lesson or End of Lesson Check for understanding
- Math Station for students that have finished work early
- Test Review
- Homework Alternative
- Bell work
My Other Systems of Equations Activities
How many solutions Sort - No solution, One Solution or Infinitely Many
Solving by Graphing - Walk Around Activity
Solving by Graphing Level 2 Walk Around Activity
Graphing Systems of Linear Inequalities - Walk Around Activity
