Graphing Logs and Exponents
Math to the Core
3k Followers
Grade Levels
10th - 12th, Higher Education, Adult Education, Homeschool
Subjects
Resource Type
Formats Included
- PDF
Pages
3 pages
Math to the Core
3k Followers
Description
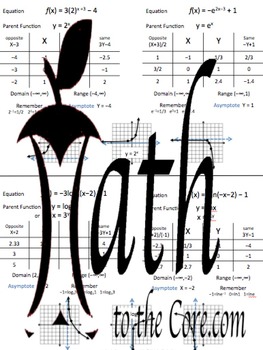
Graphing Logs and Exponents Cheat Sheet
Graphing Logs and Exponents using a table of values.
The following functions are illustrated in complete detail along with the appropriate parent function.
Asymptotes are clearly labeled along with the domain and range of the function.
My students can easily understand how logs and exponents are inverses of each other with the 4 graphs found on one sheet.
Page 1
f(x) = 3(2)^(x +3) − 4
f(x) = −e^(x−3) + 1
f(x) = −3log(x−2) + 1 with a base of 3
f(x) = 3ln(x−2) − 1
Page 2 - note more difficult horizontal shifting
f(x) = 3(2)^(x +3) − 4
f(x) = −e^(2x−3) + 1
f(x) = −3log(x−2) + 1 with a base of 3
f(x) = 3ln(−x−2) − 1
Page 3 includes graphs from page 2 with the anchor point method.
This file includes 3 pages.
Products you may also like...
View my other cheat sheets here.
Connect with Me
Follow my Website
Math to the Core on Facebook
Math to the Core Blog
Math to the Core on Pinterest
Math to the Core on Twitter
Math to the Core on Instagram
Total Pages
3 pages
Answer Key
N/A
Teaching Duration
N/A
Report this resource to TPT
Reported resources will be reviewed by our team. Report this resource to let us know if this resource violates TPT’s content guidelines.


