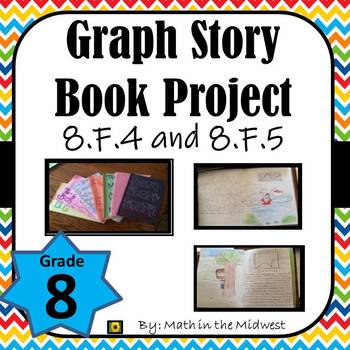
Graph Story Book Project 8.F.4 and 8.F.5: Writing in the Middle School Math Room
Description
Graph Story Book Project - Functions:
This project allows students to use multiple representations as well as be creative in math. This activity does a great job of incorporating writing into math. Students are given two graphs and must create labels, scales, and a story. Then students must create two of their own graphs as well as the labels, scales, and stories. This can either be done as an individual or partner project.
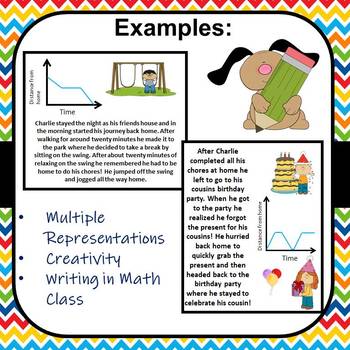
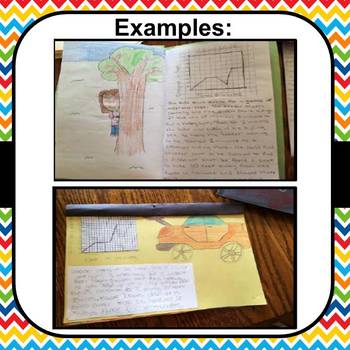
This includes a handout with directions and expectations as well as multiple examples you can show your students or even just for the teacher to see.
**************************************************************
⭐Escape Room Bundles:
- Team Building Activities/Escape Room
- Middle School Math Escape Room Bundle
- Algebra 1 Escape Room Bundle
- 8th Grade Math Escape Room Bundle
- 7th Grade Math Escape Room Bundle
⭐GOOGLE RESOURCES:
- 7th Grade Math Google Classroom Bundle
- 7th Grade Math Interactive Notebook Bundle
- 8th Grade Math Google Classroom Bundle
- 8th Grade Math Interactive Notebook Bundle
⭐PRINTABLE (PAPER) RESOURCES:
⭐ULTIMATE BUNDLES:
*********************************************
Go to my store Math in the Midwest to see all my other products. Don't forget to follow me for notifications of new products, updates, freebies, and great deals!


