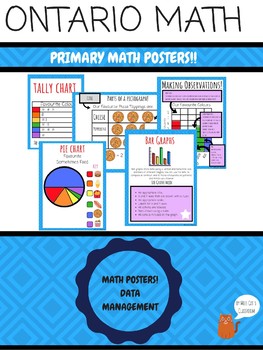
{Grade 3} Data Management Ontario Math Concept POSTERS
- PDF
Description
{Grade 3} Data Management Ontario Math Concept POSTERS
Looking for a great way to support your Data Management unit?
Want to help your students learn about horizontal and vertical bar graphs as well as pictographs?
These {Grade 3} Data Management Ontario Math POSTERS are based on the Ontario Mathematics curriculum expectations for Grade 3.
These posters are a great resource for extended students in Grade 2 or students in Grade 4 who might need to review some graphing and data management concepts.
Posters included (in both full colour *fc or inksaver black and white *bw):
PARTS OF A BAR GRAPH (fc & bw)
MAKING OBSERVATIONS (fc & bw)
PARTS OF A PICTOGRAPH(fc & bw)
GRAPHS AND CHARTS(fc & bw)
BAR GRAPH (fc)
PICTOGRAPH (fc)
TALLY CHART (fc)
PIE CHARTS (fc)
BAR GRAPHS NEED (fc & bw)
PICTOGRAPHS NEED (fc & bw)
TALLY CHARTS NEED (fc & bw)
Grade 3 Ontario Data Management Math Resources
My practice is fairly fluid, and flexible. because of this, I try to design resources that are also. There are so many different ways you can deliver this content!
(See the preview for a look at everything!)
*the cat watermark will NOT be on your purchased copy
Remember the future of the world is in your classroom today!
XO Miss Cat
****Customer Tip****
How to get TPT credits, which equal TPT cash for future purchases:
Go to your "My Purchases" page. Next to each purchase, you'll see a "Provide Feedback" button. Simply click it and you will be taken to a page where you can give a quick rating and leave a short comment for the product. Each time you give feedback, TPT gives you feedback credits that you may use to lower the cost of your future purchases. You earn 1 credit per 1 dollar of the product you leave fair feedback on. You can then cash in those credits. Example: 50 credits=$2.50 you can spend on TPT products.
I'd really appreciate it if you'd rate my item after downloading! Feedback is so VERY important!
*** PLEASE NOTE: This is formatted to poster size so make sure to adjust when printing to fit the size of paper you wish to print it on!!
Education Resource / Classroom Decor from Miss Cat's Classroom Store on TPT
{Grade 3} Data Management Ontario Math Concept POSTERS - Canada - Canadian - Overall and Specific Curriculum expectations - 3 part math lessons - math talk - math strategy - math strategies -


