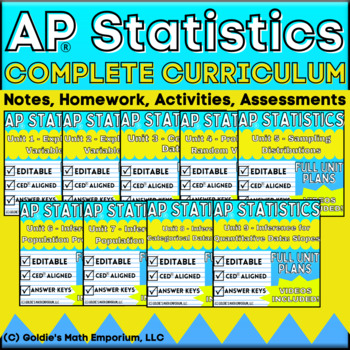
Goldie's FULL CURRICULUM for AP® Statistics
- Zip
What educators are saying
Products in this Bundle (11)
showing 1-5 of 11 products
Bonus
Description
AP® Statistics Full Curriculum
In this product, you will receive all of Goldie's products related to AP® Statistics. All 9 units follow the College Board's© CED and include the following:
Student Guided Notes
Student notes are "fill in the blank" style notes; teachers lead the lesson and work with students to complete the content. All content from the AP® CED is included and taught in the notes for this curriculum.
Content Videos
Each set of notes has a video to accompany it, where I teach the lesson so students can complete the notes. These are great for a flipped classroom, assigning notes as homework, or absent students.
Homework Assignments
There is a homework assignment with each set of notes, that allows the students to practice what they learned in the notes.
Unit Class Summaries
Each unit contains a summary lesson that comes with teacher PowerPoint slides and a student handout that reviews all the material we learned in the unit.
Assessments
Each unit comes with a quiz and a test with AP® style multiple choice questions and a free response problem, to assess student understanding.
Unit Projects
There is at least one unit project in each unit, where students are asked to apply what they have learned in a unit to a project.
Classroom Activities
There are multiple classroom activities in each unit, where students can learn and explore content outside of the traditional note setting.
Also Included:
- 1st Semester Final Exam and Study Guide
- 2nd Semester AP® Exam Review Materials
- 2nd Semester AP® Exam Projects
Bonus Files
- 2024/25 AP® Approved Syllabus
- 2024/25 Year Pacing Calendar
- First Two Days in AP® Statistics
- AP® Statistics Exam Crunch Sheet
- Binder Covers
- Content Video Document
All of the resources are 100% editable, so you are able to modify to fit your classroom needs. The zip folder includes all the Word documents for the resources, which you have permission to edit. The PDF version and answer keys are included for your convenience.
I teach this course without a textbook, so everything that is provided here, can be used without supplementation. The only thing I use in my class that is NOT included in this content is the secured AP® exam questions.
***************************************************************************************
You can take a look at the individual resources, contained in this product, below:
Unit 1 - Exploring One Variable Data
Unit 2 - Exploring Two Variable Data
Unit 4 - Probability, Random Variables, and Probability Distributions
Unit 5 - Sampling Distributions
Unit 6 - Inference for Categorical Data: Proportions
Unit 7 - Inference for Quantitative Data: Means
Unit 8 - Inference for Categorical Data: Chi-Square
Unit 9 - Inference for Quantitative Data: Slopes
Semester 1 Final Exam and Study Guide
***************************************************************************************
If you are interested in specific resources, you can check out my resources bundles:
AP® Statistics Homework Bundle
AP® Statistics Assessments Bundle
AP® Statistics Guided Notes Bundle
AP® Statistics Projects and Activities Bundle
Note: If you are purchasing the full curriculum, the homework, assessments, guided notes, and projects/activities are already included! You DO NOT need to purchase them separately. Please let me know if you have any questions about what is contained in this product.
***************************************************************************************
If you need extra explanations or guidance, I would love to help!!
AP® is a trademark registered by the College Board®, which is not affiliated with, and does not endorse, this product.
I want to provide the best possible resources to help other teachers out! You will be notified of any future updates and additions to this product and it will be free of charge. Your support is important and I thank you for allowing me to continue doing what I love to do.
© Goldie’s Math Emporium, LLC
This work is bound by copyright laws and editing (beyond your own classroom use), selling, redistributing, or posting all or part of these documents on the Internet is strictly prohibited. Violations are subject to the Digital Millennium Copyright Act.


