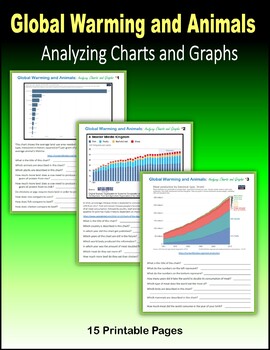
Global Warming and Animals - Analyzing Charts and Graphs
- PDF
- Easel Activity
Description
15 printable or digital pages for students to analyze charts and graphs on global warming and animals:
- how much land it takes to produce an ounce of meat protein,
- how many animals are on the endangered list due to human expansion,
- the increases in meat eating over the years,
- the number of exotic animals in the wild,
- money spent on animal research,
- the biomass of livestock over the years,
- marine creatures,
- and more...
PRINT: I created a PDF version that you can download on your computer and print for students to use in class or at home. Click on "Add one to cart" and download your copy.
DIGITAL ACTIVITY: I created a digital version with text boxes so students can type in the answers using a computer or tablet (for Distance Learning). Click on "Create Digital Activity" and link the activities to your Google Classroom. Online Resource. Yes, I already added the interactive layer to each page. Enjoy!
Take a look at the Preview to see sample pages. And if you want more CHARTS and GRAPHS:
Food Charts and Graphs - 21 pages
Winter Weather Charts and Graphs - 20 pages
Christmas Charts and Graphs - 20 pages
Winter Olympics (Reading Charts and Graphs) - 10 pages
Presidents' Day - Analyzing Charts and Graphs - 22 pages
Immigration - Charts and Graphs (Mexico) - 23 pages
Covid-19 (Coronavirus) Analyzing Charts and Graphs - 58 pages
Mushrooms - Charts and Graphs, Describing, Compare and Contrast, Writing - 11 pages
Global Warming and Solar Energy - Analyzing Charts and Graphs - 17 pages
Global Warming and Wind Power - Analyzing Charts and Graphs - 17 pages
Global Warming and Animals - Analyzing Charts and Graphs - 15 pages
Global Warming and Coal - Analyzing Charts and Graphs - 15 pages
Global Warming and the Ocean - Analyzing Charts and Graphs - 15 pages
Global Warming and Temperature - Analyzing Charts and Graphs - 13 pages
Global Warming and Glaciers - Analyzing Charts and Graphs - 11 pages
Global Warming and Transportation - Analyzing Charts + Graphs - 15 pages
Global Warming and Trash - Analyzing Charts + Graphs - 16 pages
And if you want more on GLOBAL WARMING:
Storms, Hurricanes, Tornadoes and Global Warming
Will Plants Survive Global Warming
Electricity and Global Warming
What Will Happen to our Food with Global Warming
How Buildings Contribute to Global Warming
Greta Thunberg - Internet Research Projects
Greta Thunberg - Quotes about Global Warming and the Climate Crisis
Greta Thunberg - Writing Prompts on Global Warming
And if you want more on ANIMALS, then take a look at these:
Global Warming and Animals - Analyzing Charts and Graphs
Asking Questions about Animals
Asking Questions about Wildlife
What Do I Know about Animals (100 Writing Prompts)
Exploring Wildlife: Plants and Animals (PowerPoint)
Spanish Vocabulary - Animals and Wildlife (PowerPoint)
BINGO - Animals (Spanish Vocabulary)
Internet Research on Sea Animals


