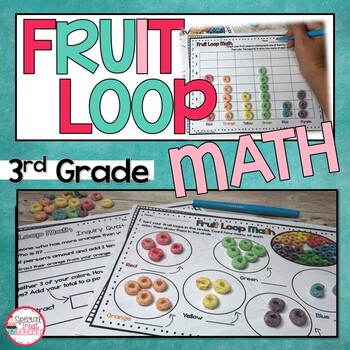
Fruit Loop Math Activities and Graphing Activities for Older Kids
- PDF
What educators are saying
Description
Using this Back to School Math Activity will help you to assess your students and they will have fun a the same time. It is interactive fun with math. This is a great way to go from Summer Brain to School brain in math without opening the textbooks yet. This is math with a tasty twist.
CHECK OUT THE 1st/2nd GRADE VERSION
OVERVIEW
The students will be given a handful of Fruit Loops by the teacher and they will practice sorting by color, graphing, place value, adding and subtracting, put them on a number line to count the total, graph the class totals, math inquiry questions and predictions. They work with groups, add large numbers, and see if their predictions were correct.
INCLUDED
- Graphing Sheet where students will make a bar graph with their Fruit Loops. They will get to color in their graph and then answer inquiry questions with classmates about the data.
- Class Graphing Sheet set up for larger numbers
- Lesson Plans and a suggested way to use the resources
- Inquiry Question Sheets where students will ask classmates various questions on their data
- Various Differentiated Worksheets in color and Black and White
- Interactive Lesson Opportunities
- Extension Ideas includes several more lesson plan ideas that can be done with the lesson or on another day.
- Color Sorting Worksheet
- Group Work Adding for large numbers
Fruit Loops not included!
HOW IT IS SET UP
The teacher has students make predictions about the activity and even get to add the information onto a prediction sheet. Then the teacher passes out a handful of Fruit Loops to each student. The students start with sorting the Fruit Loops by color and counting. Then the students will graph the data. This is a great opportunity to see what they know about graphing. The students will also get to count the total number and there is an easy to use number line for those that need it. They break those numbers into finding the tens and ones. The activity is wrapped up by an inquiry questions sheet, gathering class data and of course eating the Fruit Loops by a listening activity.
HOW IT BENEFITS YOUR STUDENTS
Students love this math lesson because they get to eat Fruit Loops! They think it is the coolest activity. Most students are so engaged in the activity that they don't realize that their teacher is walking around gathering data for the year. Students enjoy learning math without opening their text books. It is a great opportunity to see how the students do with self control.
Check out our BLOG article on how this will look in your classroom.
Don’t forget that leaving feedback earns you points toward FREE TPT purchases. I love FEEDBACK!
LET'S CONNECT Special Treat Friday Blog | Writing Membership | TPT | Facebook | Instagram | YouTube
As always, please contact me with any questions.
Thank you so much,
Special Treat Friday, Heather McKinsey


